


11Beamage-3 User
’s Manual Revision 4.0
51
Standa Ltd. All rights reserved
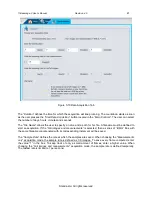
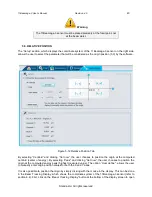
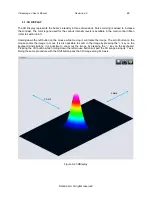
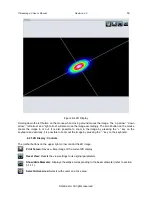
6.3. XY DISPLAY
The
XY
display plots cross-sectional graphs of the beam along the crosshairs. The crosshairs position
and orientation are defined in the
Home
tab (refer to section 5.1.1.2)
Figure 6-5 XY Display
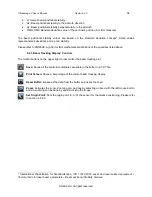
6.3.1. XY Display: Controls
The toolbar buttons on the upper right corner control the XY graphics.
Save:
Saves the crosshair information in a .TXT file. If the
“Gaussian Fit”
was activated, the
equation of the curve will also be saved in the file.
Zoom:
Activates the zoom for both graphics individually. Zooming can be done by selecting an
area with the left mouse button. Double-clicking the image returns to the original state..
Gaussian Fit:
Shows/Hides the best fitted Gaussian along the experimental curve. Refer to
section 6.3.2 for more information.
Semi-Log:
Transforms the linear graphics to semi-logarithmic graphs to enhance the details in the
low intensity parts of the beam.
Cursor Position:
Shows/Hides a cursor on each graph with their intensity and position value in
the graph’s upper right corner. The cursors are positioned by clicking on the desired spots with the
left mouse button.
FWHM:
Shows/Hides the level corresponding to the half maximum value.