


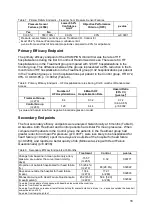


Table 7. Primary Safety Endpoint – Freedom from Pressure Sensor Failures
Pressure Sensor
Failures (n=550)
Lower 95.2%
Confidence
Limit
2
Objective Performance
Criterion (OPC)
p-value
3
Yes
No
0 (0.0%)
550 (100%)
1
99.3%
90%
p<0.0001
1
Pressure sensor failure counts by group: Treatment (0), Control (0)
2
Exact 95.2% Clopper-Pearson lower confidence limit
3
p-value from exact test of binomial proportions compared to 90% for all patients
Primary Efficacy Endpoint
The primary efficacy endpoint of the CHAMPION clinical trial was the rate of HF
hospitalizations during the first 6 months of Randomized Access. There were 84 HF
hospitalizations in the Treatment group compared with 120 HF hospitalizations in the
Control group. This difference between the groups represented a 28% reduction in the 6-
month rate of HF hospitalization in the Treatment group (0.32 hospitalizations per patient
in the Treatment group vs. 0.44 hospitalizations per patient in the Control group, HR 0.72,
95% CI 0.60-0.85, p = 0.0002) (Table 8).
Table 8. Primary Efficacy Endpoint – HF Hospitalization rates During First 6 months of Randomized
Access
Number of
HF Hospitalizations
6 Month HF
Hospitalization Rate
Hazard Ratio
(95% CI)
[p-value]
1
Treatment Group
(n=270)
84
0.32
0.72
(0.60-0.85)
p=0.0002
Control Group
(n=280)
120
0.44
1
p-value and hazard ratio from negative binomial regression model
Secondary Endpoints
The four secondary efficacy endpoints were analyzed hierarchically at 6 months (Table 9).
At baseline, both Treatment and Control patients had similar PA mean pressures. When
compared with patients in the Control group, the patients in the Treatment group had
greater reduction in mean PA pressure (p=0.0077); were less likely to be hospitalized for
heart failure (p=0.0292); spent more days alive outside of the hospital for heart failure
(p=0.0280); and reported a better quality of life (Minnesota Living with Heart Failure
Questionnaire) (p=0.0236).
Table 9. Secondary Efficacy Endpoints at 6 Months
Treatment
Control
p-value
Change from baseline in mean pulmonary artery
pressure, area under the curve (mean mmHg-
days
)
-155.7
(n=265)
0.32
0.00771
Proportion of patients hospitalized for heart failure
(%)
55 (20.4%)
(n=270)
80 (28.6%)
0.02922
Days alive outside the hospital for heart failure
(mean)
174.4
(n=270)
172.1
(n=280)
0.02803
Minnesota Living with Heart Failure Questionnaire
(mean[median])
45.2 [45.0]
(n=229)
50.6 [52.0]
(n=236)
0.02364
1 p-value from analysis of covariance with baseline pressure as the covariate
2 p-value from Fisher's exact test
3 p-value from Wilcoxon rank sum test after controlling for subject duration in study (i.e., days alive outside the hospital /
subject duration x 180)
4 p-value from two-group t-test
16


