


Chapter 6 — Monitoring a Verde Array
Monitor the Verde Arrays
September 2017
User Guide
—
Spectra Verde Array
115
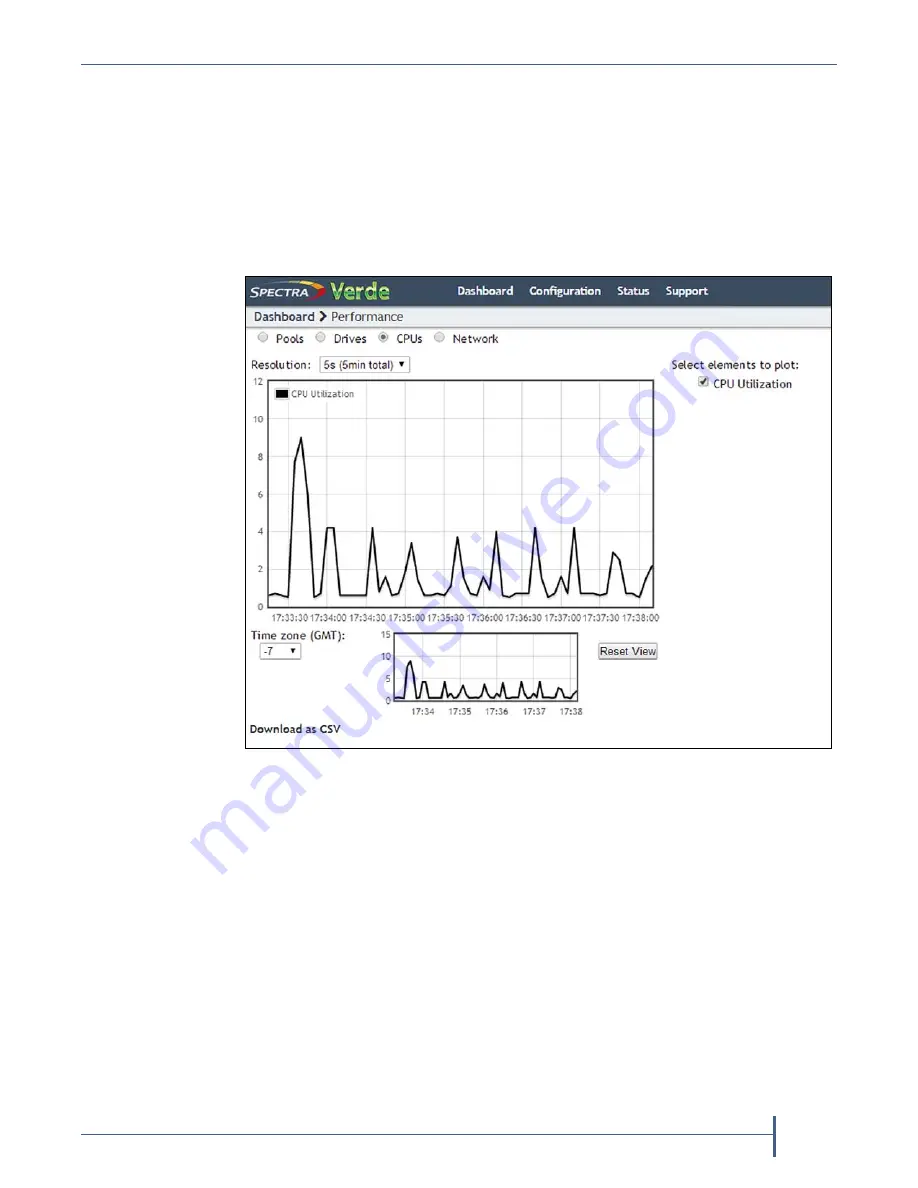
View Performance Metrics
The
Performance
screen
displays
performance
metrics
for
the
Verde
array
storage
pools,
individual
data
drives,
CPUs,
and
network
traffic.
Performance
graphs
can
be
configured
to
display
either
the
last
5
minutes
of
activity,
or
the
last
25
hours.
1.
From
the
menu
bar,
select
Status > Performance
or
click
the
Performance
pane
on
the
Dashboard.
The
Performance
screen
displays.
2.
Select
Pools
,
Drives
,
CPUs
,
or
Network
to
display
performance
information
about
the
selected
component.
Note:
If
you
select
Pools
,
Drives
,
or
Network
,
use
the
Pool
,
Disk
,
or
Interface
drop
‐
down
menu
to
select
a
specific
storage
pool,
disk
drive,
or
network
connection
to
display.
3.
Select
the
time
interval
using
the
Resolution
drop
‐
down
menu.
The
data
can
be
displayed
in
5
second
increments
(5
minutes
total)
or
60
second
increments
(25
hours
total).
4.
Select
or
clear
options
under
Select elements to plot
to
indicate
which
graph
lines
to
display.
The
graph
updates
as
soon
as
you
select
or
clear
an
option.
5.
Set
the
performance
graph’s
time
values
to
your
local
time
zone
using
the
Time zone
menu.
All
entries
are
listed
in
+/
‐
GMT.
Figure 88
The Performance screen.