User Manual - twentynine
Histogram calculation can be applied to monochromatic or RGB image data. The number of resulting
histograms corresponds to the number of channels.
In the previous example there is only a single
histogram for the monochrome image. However, on RGB color images are three histograms generated,
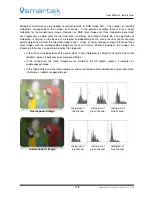
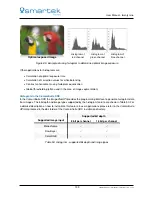
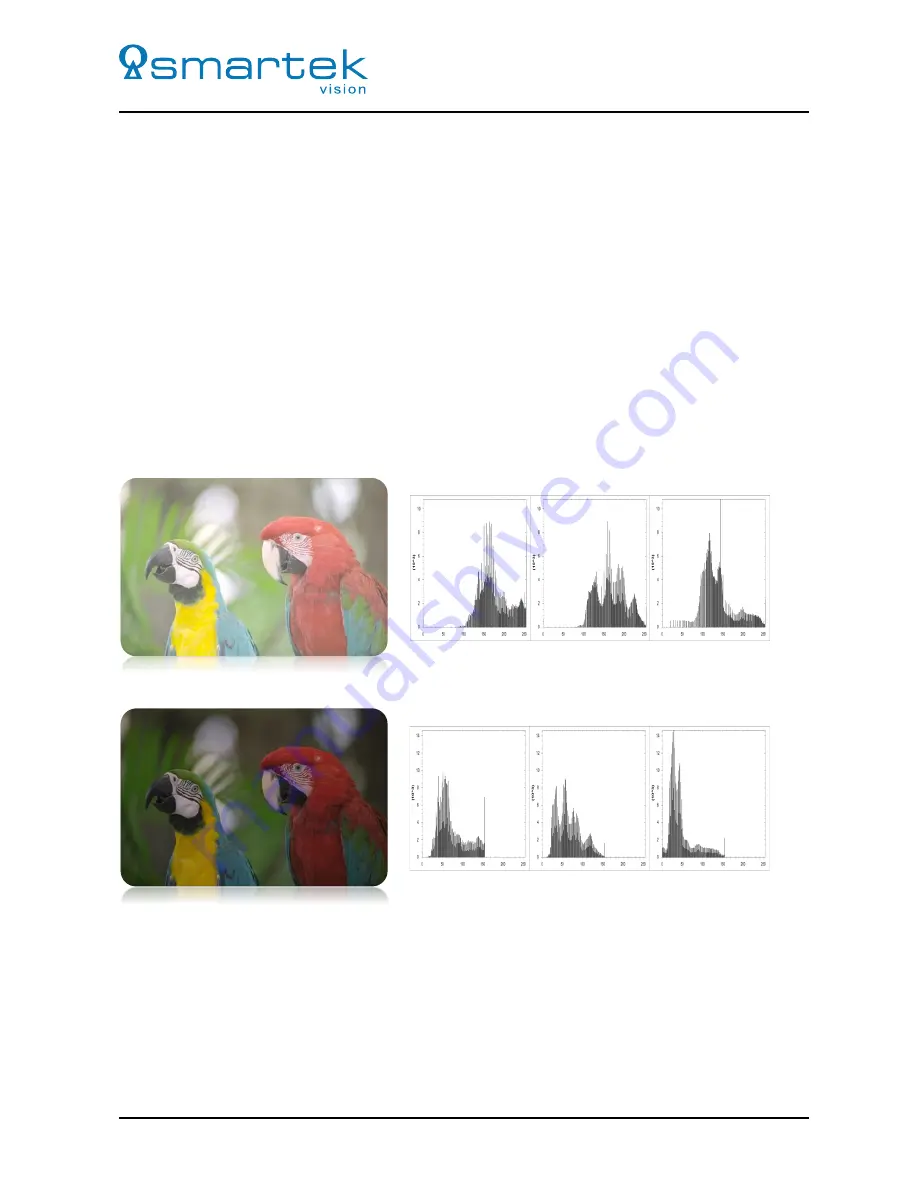
each represents a single color channel (red, green and blue), illustrated in Figure 85. The application of
histograms is varying; on the basis of a histogram and depending on the scene the user can for example
quickly determine whether the captured image is over-, under- or normal-exposed. Figure 85 shows three
color images with the corresponding histograms for each channel. Without looking to the images, the
following information can be determined by the histogram:
•
In the first row the population of the pixel values in each histogram is shifted to the right of the center
(brighter region); it indicates an overexposed image.
•
In the second row the three histograms are shifted to the left (darker region); it indicates an
underexposed image.
•
In the third and last row the three histograms show a centered uniform distribution of pixel intensities;
it indicates an optimal exposed image.
Overexposed Image
Underexposed Image
Histogram of
red channel
Histogram of
green channel
Histogram of
blue channel
Histogram of
red channel
Histogram of
green channel
Histogram of
blue channel
108
SMARTEK Vision | User Manual - twentynine | Doc. v1.0.2

