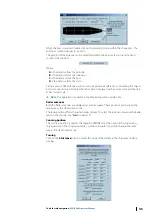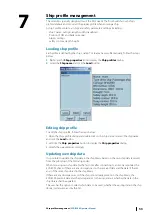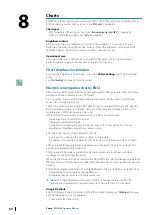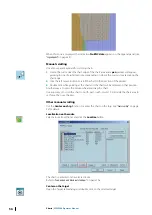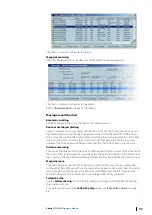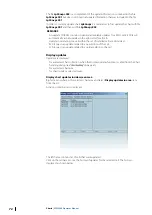
Chart borders
Chart borders indicate the chart status and permit status for the particular chart.
Ú
Note:
In case the chart is out of date or not installed, its border is displayed as dashed
line. The color of line corresponds to the permit status.
The chart borders have color that corresponds to their status with following solid lines:
•
red: the permit is expired or invalid for current HWID
•
yellow: the permit will be expired in less than one month
•
green: the permit is valid
•
black: the chart does not need a permit
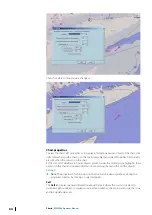
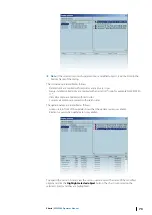
In the picture below the following charts are represented:
•
green solid border: up-to-date chart with the valid permit
•
green dashed border: out-of-date chart with the valid permit or the chart is not installed,
but its permit is valid
•
solid yellow border: up-to-date chart with the permit that will be expired in less than one
month
•
dashed yellow border: out-of-date chart with the permit that will be expired in less than
one month, or the chart is not installed and the permit will be expired in less than one
month.
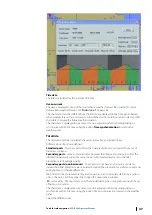
Chart settings
When a ENC chart is first displayed, the cell is displayed at the largest scale available in the
SENC for the displayed area and the standard display provided. When several cells appear on
the display the boundaries between cells are displayed.
Ú
Note:
It is not possible to remove information contained in the display base.
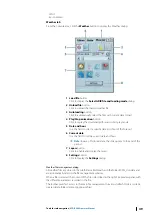
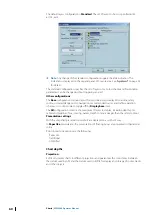
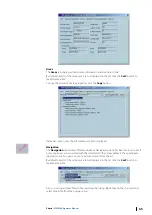
The
Presentation
tab contains configuration settings of the chart display.
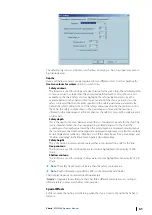
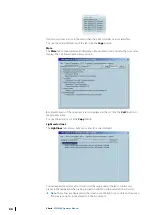
The
Chart Depth
tab is used for setting the chart projection type, safety and contours
values, which depend on the ship characteristics (see
are extremely important because they will change the chart display and be used for the anti
grounding calculation.
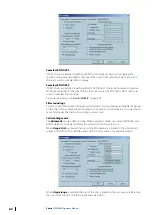
The
Special Effects
tab contains ENC/ARCS/AVCS seamless mode options, flashing lights
and manual chart band usage (see
For
Supplementary Layers
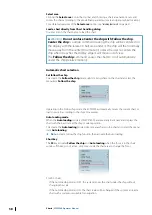
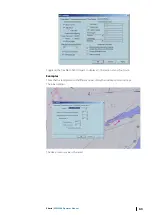
Right click anywhere on the chart and select
Chart settings
.
Presentation
Standard layer configuration
Charts
| ECDIS900 Operator Manual
59

