


39 |
P a g e
R e v 5 - 1 9
Reflectance bar
chosen by the customer.
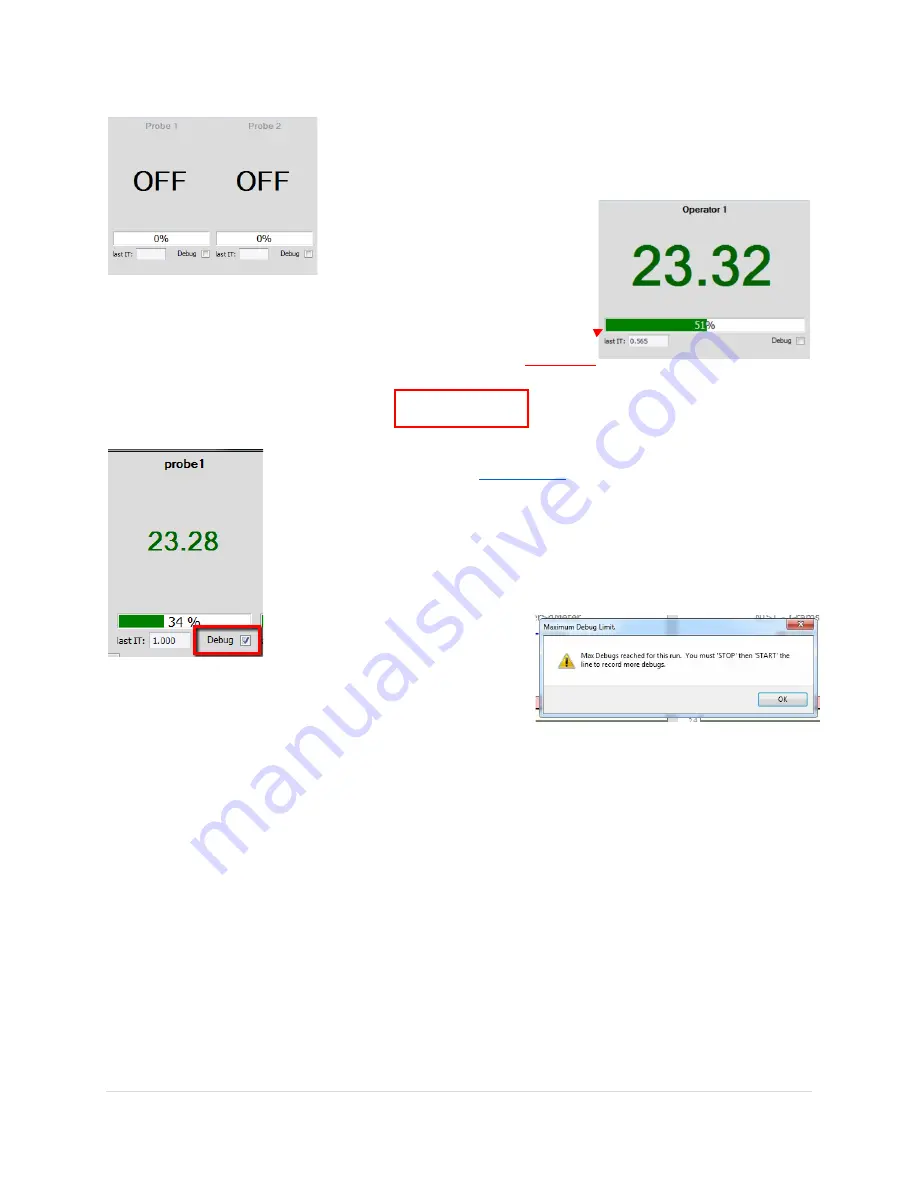
The image to the left shows how measurement output is displayed (in
real-time) when the probe, or probes, in this case, are inactive.
The image to the right takes a closer look and shows how measurement
output is displayed (in real-time)
when each probe is active.
Keep in mind that in both cases,
probe names are arbitrary and will be
The bar underneath the thickness value may appear green or red. It
represents the Reflectance percentage at that moment when a
measurement is taken.
Debug
From time to time you may need to do a more in-depth analysis of your
. You will want to create a debug
file to load into the Analysis Tool. To do this, you open your Inline panel and
select the “Debug” tick box closest to the Reflectance bar of the probe you
want to take debug readings of. This will collect detailed information of the
next 100 readings made by your probe and then it will fall out of debug. This
means the box will only stay selected for a few seconds before it turns off.
You can make up to five debug
readings per probe before you get a
warning message that no more
debug logs can be created until Stop and then Restart the
line. This is to prevent too many debugs logs being created
and perhaps filling up your hard drive to capacity.
See
In-Line Wave Analysis Tool
section below for more information on how to use Debug Files.