


USER MANUAL
EvaluationTool
STIM202 Evaluation Kit
DOK333 rev.06 18/22 Dec 2017
7.5
Measure panel descriptions
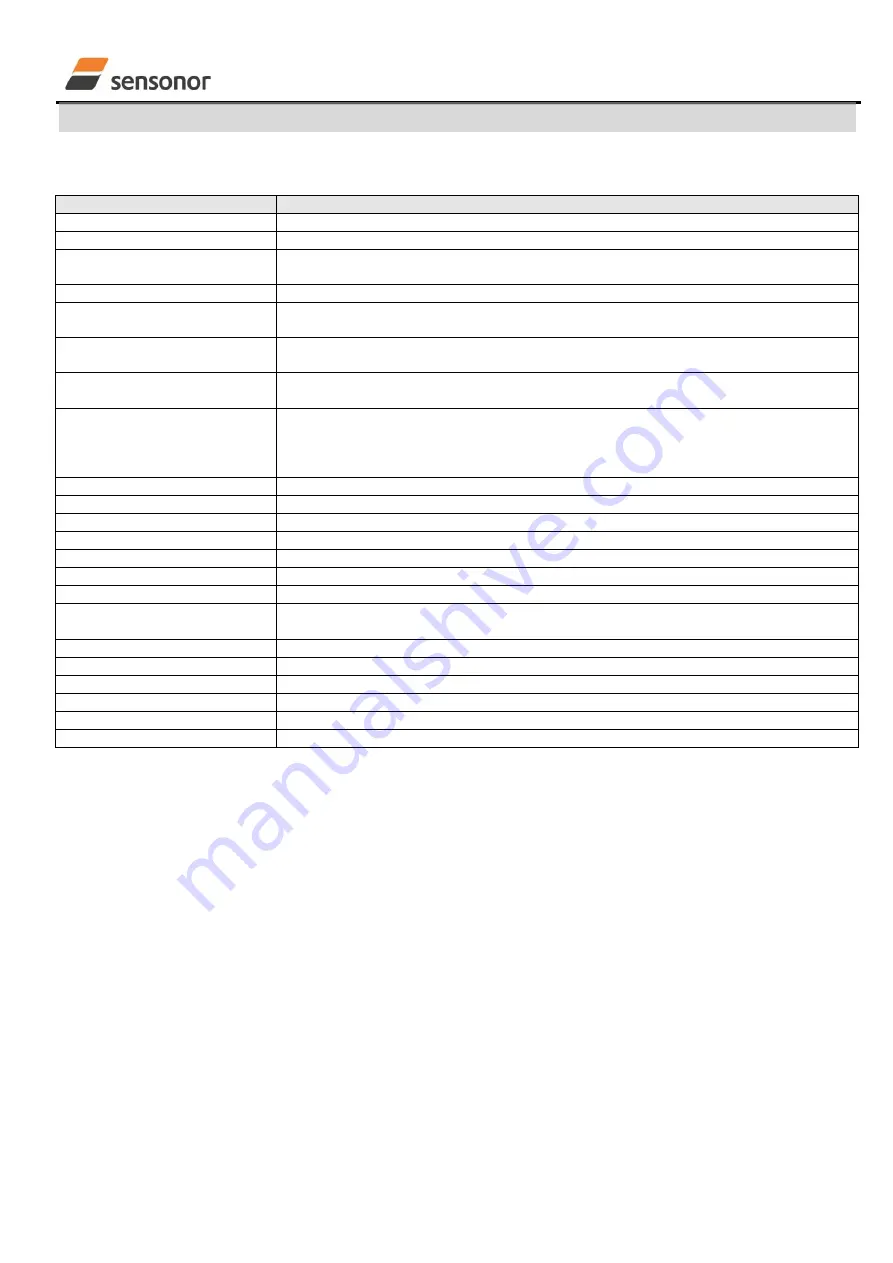
Table 3: Measure panel descriptions
Panel unit
Functionality and description
Measure button
Starts a measurement series
Samples box
Defines the number of samples to be collected (max 50 millions)
Save to file button
Saves data from a completed measurement series to a result file. The file path
defined in the active parameter file is proposed
X-, Y- and Z-axis check boxes
Selects which axis data to present in the graph area (up to 3 axes can be plotted)
Relative and absolute toggle
switch
When set to ‘Absolute’, all results are plotted as received. When set to ‘Relative’ the
curves are translated so that the first measurement is shown in the plot as zero.
Active device indicator
Informs about the active gyro module (device). Corresponding COM port is according
to the active parameter file
CRC and DG-ID LEDS
Confirms all CRC checks and DG-IDs as expected. Normally GREEN. LEDs turn
RED if checks fail
Data box
Selects which datagram content to be shown. Several options are available,
depending on the active datagram type. Use the arrows in the left side of box to
scroll between available selections. The plot updates immediately if a measurement
series has already been done.
Scale box
Enables user to select between different scales (Full range, User defined, or Auto)
Sample rate box
Informs what sample rate has been used for the measurements
Unit box
Indicated the active Output unit (Angular Rate, Incremental Angle, etc.)
DG type box
Shows the type of datagram received
Save to disk icon
Saves a picture of the plotted data to file
Print icon
Prints a picture of the plotted data to the default printer
1:1 icon
Resets zoom level to 1:1 (if ZOOM is active. See below)
Zoom icon
Enables a custom zoom of the presented results in the strip chart (graph area)
according to placement of available cursors
Cursors (On/Off) switch
Enables usage of cursors (default is Off)
Cursor 1
Shows the location of cursor no 1
Cursor 2
Shows the location of cursor no 1
Delta
Shows the delta between the two cursor locations (X and Y values)
Progress bar
A blue continuous line shows the measurement series progress
Lower bar on panel
Shows the INI-file in use and the active mode (NORMAL MODE)


