


Applications
R&S
®
RTM3000
180
User Manual 1335.9090.02 ─ 08
1
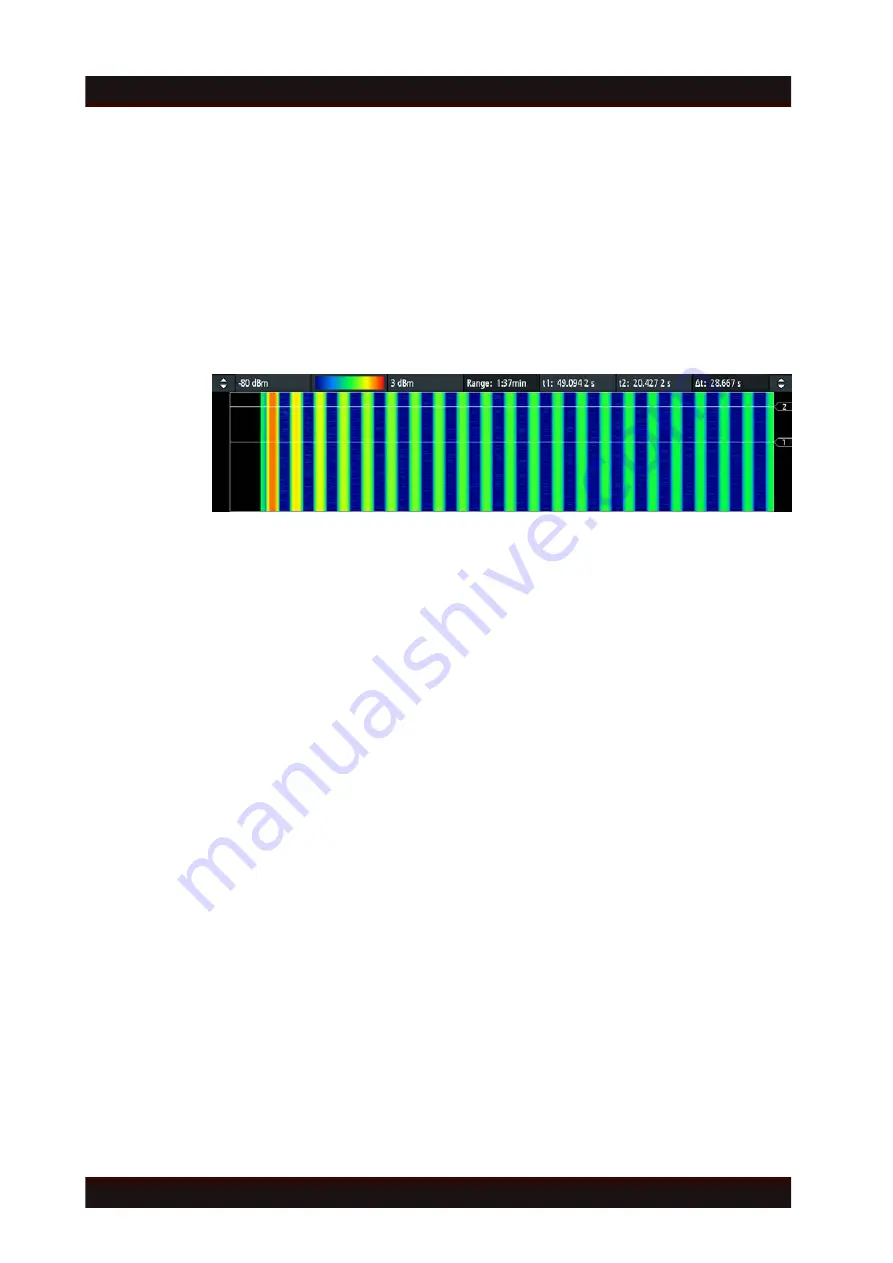
= Maximum level for color scale (setting)
2
= Display of color scale
3
= Minimum level for color scale (setting)
4
= Range (information)
5, 6, 7 = Positions of the time cursors in the spectrogram, and their time difference
Time cursors
When acquisition is stopped, you can set two time cursors in the spectrogram. Use the
time cursors to identify abnormalities in the spectrogram. The time and time difference
are displayed on top of the spectrogram window.
Figure 8-2: Spectrogram with time cursors
History and spectrum analysis
The history function allows you to browse the spectrums. You can display and analyze
not only the current frequency waveform but also older ones. You can also see and
analyze the time-based waveform on which the selected FFT was done. The displayed
spectrum is marked in the spectrogram by a white line with "Seg" label.
Using the history and segmented memory requires option R&S
RTM-K15.
1. Run an FFT.
2. Enable the spectrogram.
3. Activate the history.
Acquisition is stopped, and the time cursors and the segment cursor are visible. If
they are not visible, close all menus.
4. Select a segment:
● Use the history player to browse and select a segment, see
"Segment Table and History Player"
● Drag the segment marker in the spectrogram.
The spectrum and time-based waveform of the selected segment are displayed.
8.3.3
Peak List and Markers
You can define various criteria for a peak search. The peaks are indicated in the fre-
quency diagram by markers, and the measured peak frequencies and magnitudes are
Spectrum Analysis and Spectrogram (Option R&S
RTM-K18)
www.allice.de
Allice Messtechnik GmbH


