


Trying Out the Instrument
R&S
®
FSPN
53
Getting Started 1179.4370.02 ─ 01
5.3.3
Cross-Correlation Gain Indicator
How to control the cross-correlation gain indicator (gray area)
The gray trace, or cross-correlation gain indicator, indicates the ideal position of
the measurement trace for the current number of cross-correlation operations.
Thus, the position of this area depends on the number of cross-correlations that
are currently applied in each half decade.
This in turn indicates that measurement traces that are close to the gray area
(even if only in places) can be improved by increasing the cross-correlation oper-
ations. On the other hand, when the measurement trace lies above the gray area
throughout (about 10
dB), it is not possible to improve the results any more.
1. Enter the "Overview" dialog box, and from there, enter the "Noise Config" dia-
log box.
2. Select the "Noise Config" tab.
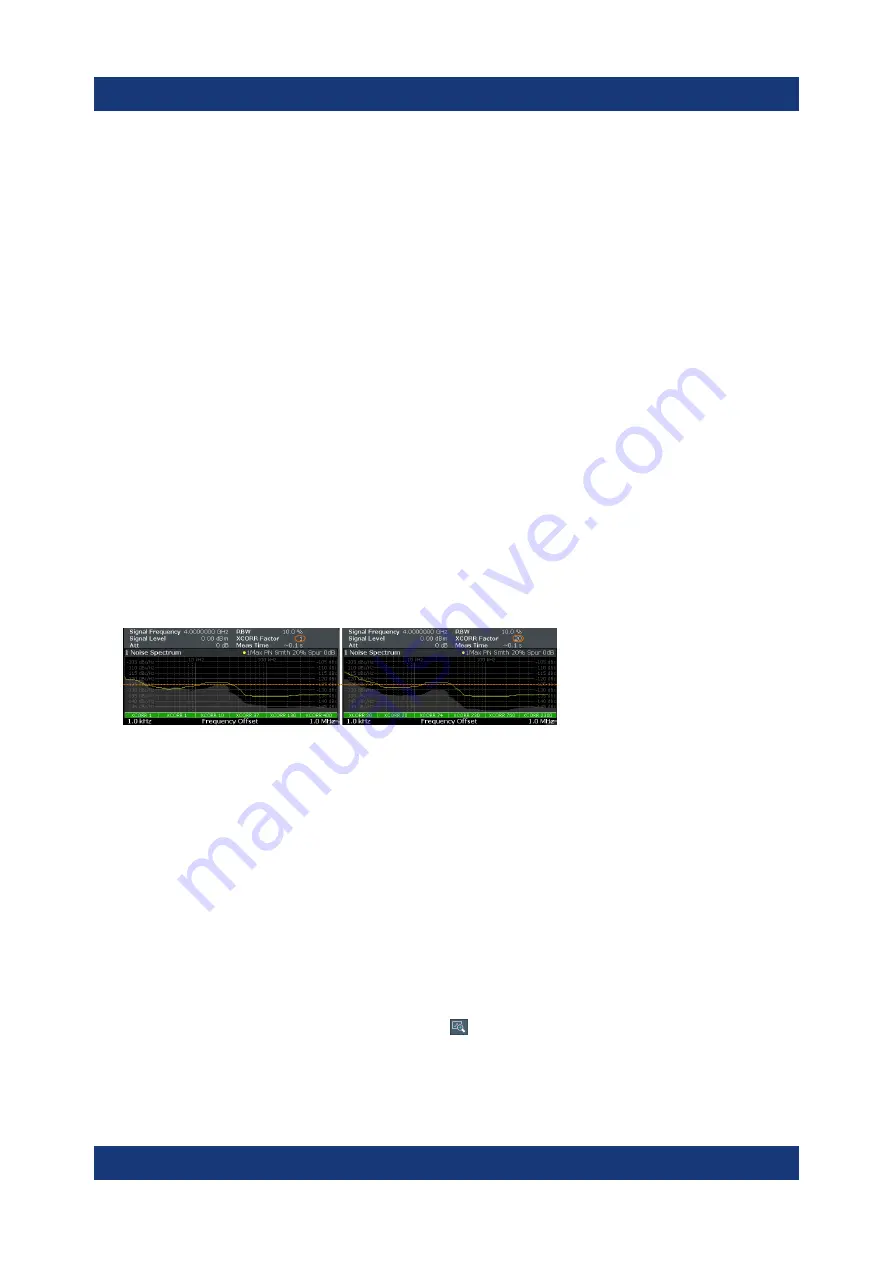
3. Change the "XCORR Factor", run a single measurement, and see how the
position of the gray area changes.
Figure 5-4: Increasing XCORR operations changes shape of gray area
4. If required, you can turn this area on and off as required with the "XCORR
Gain Indicator" feature.
5.3.4
Miscellaneous Evaluation Tools
Zooming into the results
The zoom tool is useful if you want to see parts of the results in more detail.
1. Select the "Zoom" icon in the toolbar ( ).
2. In the diagram, select the area you want to zoom in to (while doing this, the
area is marked by a dotted line).
Result Evaluation


