3.
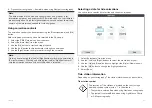
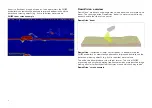
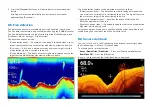
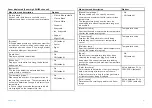
Centerline
— The solid line represents the centerline of your vessel. left
of the centerline represents the water, objects and bottom to the port
side of your vessel, right of the centerline represents the starboard side.
4.
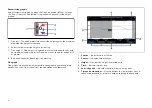
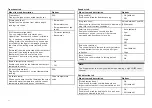
Turbulent water
— turbulence in the water caused by such things as
vessel wake can produce a sonar return due to the aeration in the water.
5.
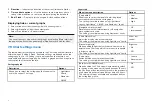
Water depth
— When using a separate depth transducer current depth
can be displayed in a data overlay.
6.
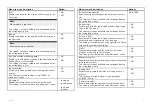
Vegetation
— Examples of vegetation growth (e.g: trees) on the bottom.
7.
Bait ball
— Example of a bait ball at an approximate distance of 18.5
ft from your vessel.
8.
Structure
— Example of bottom structure. Underwater structures such
as pipelines, piers and other large solid structures may cause an area of
shadow directed away from your vessel’s direction.
9.
Vessel direction
— Vessel direction of travel. The sonar image will scroll
from top to bottom as your vessel moves.
10.
Bottom
— Solid mass indicating the bottom, using the default color
palette the bottom is colored copper. It may be possible to identify
the transition of bottom material (e.g.: where an area of mud meets an
area of gravel).
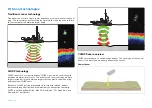
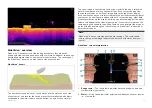
RealVision™ 3D overview
RealVision™ 3D transducers combine DownVision™, SideVision™, high
frequency CHIRP Sonar, and RealVision™ 3D to deliver life-like 3D sonar
imagery.
RealVision™ 3D provides a true, easy-to-understand view of bottom
topography, debris, and fish.
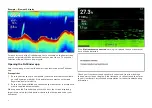
RealVision™ 3D screen example
Note:
The “Depth” figure shown in the illustration above assumes that you
have a device in your system that provides depth data. Please be
aware that not all transducers and / or sonar modules support depth
sensing. For more information, refer to the latest specifications and
documentation available for your particular products on the Raymarine®
website (
).
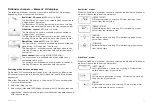
8.2 Sonar channel range
Range capabilities of the available sonar channels are shown below.
Note:
Stated range are for optimum conditions and are dependent upon
connected transducer.
96


