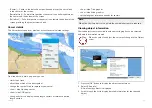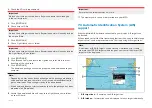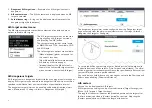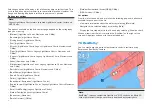
6. Dynamic current graphic — Available when using Navionics cartography.
Note:
The data provided in the tide and current graphs and graphics is for
information purposes only and must NOT be relied upon as a substitute for
prudent navigation. Only official government charts and notices to mariners
contain all the information needed for safe navigation.
Using animation controls
The animation controls can be selected using the
[Directional pad]
and
[OK]
button.
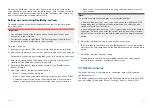
With cartography containing tide data selected in the Chart app:
1. Select the
[TIDES]
mode icon from the menu.
2. Select
[Animate tides]
from the menu.
3. Use the
[OK]
button to start and stop playback.
4. Use the
[Left]
button to skip backwards through the animation.
5. Use the
[Right]
button to skip forwards through the animation.
Note:
Pressing and releasing the
[Left]
or
[Right]
buttons will skip the animation in
15 minute intervals. Pressing and holding the
[Left]
or
[Right]
buttons will
skip the animation continuously, until the button is released.
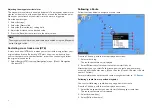
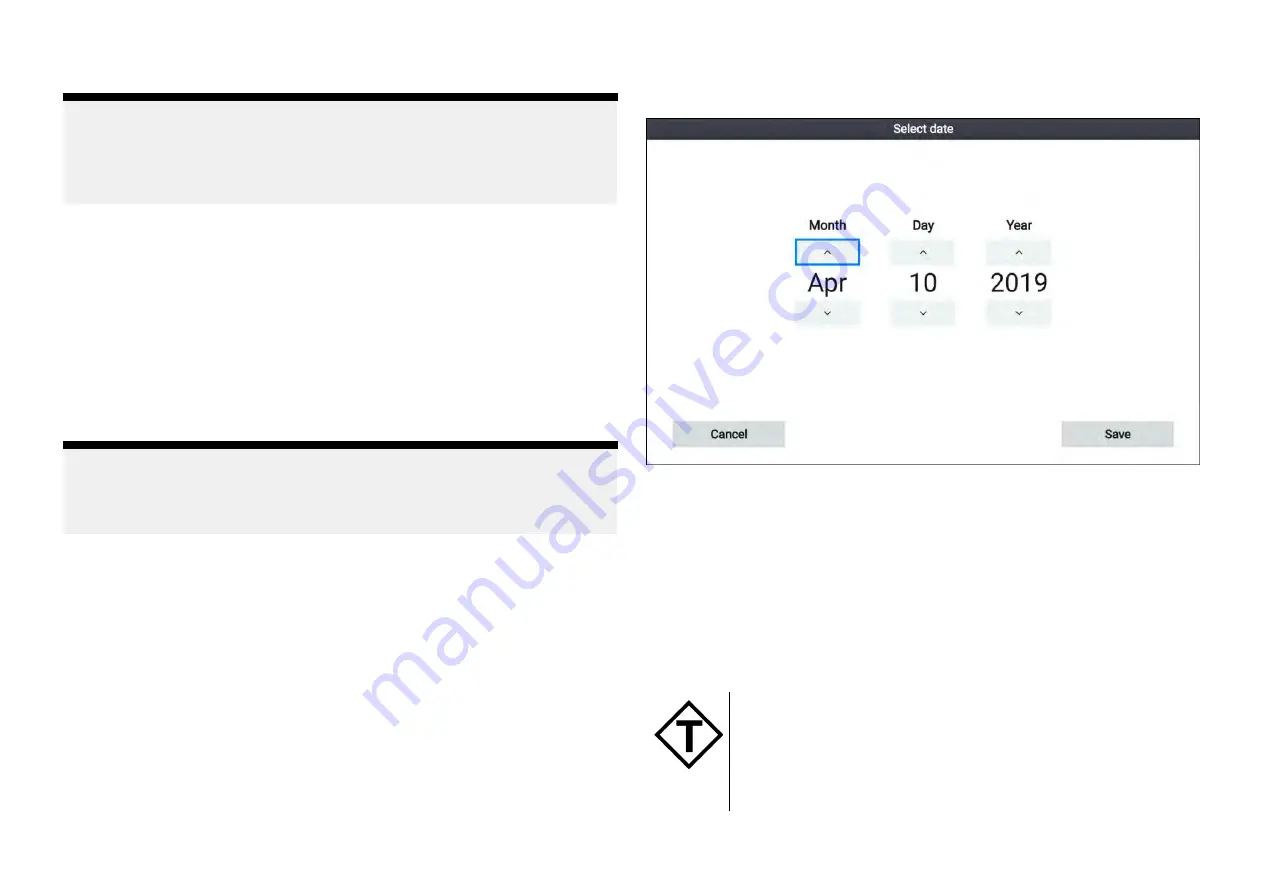
Selecting a date for tide animations
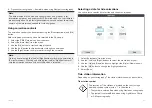
You can select a specific date for tide and current animations.
1. Select
[Select date]
from the menu.
2. Use the
[Left]
and
[Right]
buttons to select the month, day or year.
3. Use the
[Up]
and
[Down]
buttons to highlight the
[Up]
or
[Down]
arrows
4. Use the
[OK]
button to change the highlighted value.
5. Select
[Save]
.
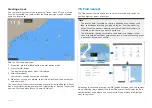
Tide station information
Depending on your cartography, Tide station information may be available.
Tide station symbol
The location of Tide stations is marked on the chart using a
diamond-shaped symbol with a ‘T’ in the middle.
• The symbol is colored Red when using Navionics cartography.
• The symbol is colored Black when using LightHouse Charts
or C-Map cartography.
83

