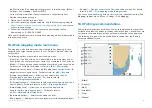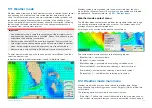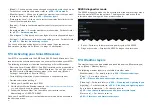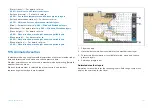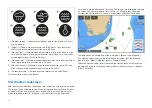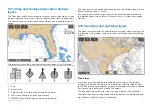
•
1
,
2
and
3
represent historical data.
•
4
,
5
and
6
represent current data.
•
7
,
8
and
9
represent forecast data.
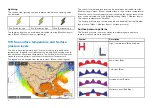
•
1
,
4
and
7
represent a hurricane (category 1 to 5).
•
2
,
5
and
8
represent a tropical storm.
•
3
,
6
and
9
represent a tropical disturbance, tropical depression.
Storm data is available from the context menu when a symbol is selected.
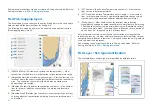
Surface wind fields (wind radii) are shown using colored shape representing
the wind field area and speed.
•
Pink
— wind speed = 64 knots or greater.
•
Orange
— wind speed = 50 knots or greater.
•
Yellow
— wind speed = 34 knots or greater.
The storm cast layer can be enabled and disabled from the
[Weather layers]
menu:
[Menu > Weather layers > Storm cast]
.
The storm tracks layer can be enabled and disabled from the
[Weather
layers]
menu:
[Menu > Weather layers > Storm tracks]
.
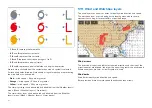
17.11 Wind and Watchbox layers
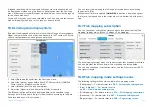
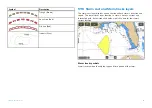
The wind layer uses arrows or barbs to identify wind direction and speed.
The watchbox layer uses red polygons to identify areas where severe
weather is occurring or forecast within a specified range.
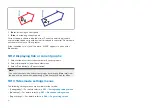
Wind arrows
The direction of the arrows indicates the wind direction and the size of the
arrow indicates wind speed, the larger the arrow the greater the wind speed.
Where conditions are calm a circular symbol is used.
Wind barbs
Wind barbs identify wind direction and speed.
Barbs provide a more accurate speed identification than arrows.
242
Содержание LIGHTHOUSE 4
Страница 2: ......
Страница 4: ......
Страница 20: ...APPENDIX C HARDWARE AND SOFTWARE COMPATIBILITY 478 APPENDIX D DOCUMENT CHANGE HISTORY 480 20...
Страница 414: ...414...
Страница 451: ...4 Select Delete again to confirm 5 Select OK YachtSense ecosystem 451...
Страница 484: ......
Страница 503: ......


