Chapter 6: Using the Web Interface
349
2.
Click Run Ping to ping the host. The Ping results are then displayed.
Trace Route:
1.
Type values in the following fields.
Field/setting
Description
Host Name
The IP address or name of the host whose route
you want to check.
Timeout(s)
A timeout value in seconds to end the trace route
operation.
Use ICMP Packets To use the Internet Control Message Protocol
(ICMP) packets to perform the trace route
command, select this checkbox.
2.
Click Run. The Trace Route results are then displayed.
List TCP Connections:
1.
Click the List TCP Connections title bar to show the list.
Downloading Diagnostic Information
Important: This function is for use by Raritan Field Engineers or
when you are directed by Raritan Technical Support.
You can download the diagnostic file from the PX3 to a client machine.
The file is compressed into a .tgz file and should be sent to Raritan
Technical Support for interpretation.
This feature is accessible only by users with Administrative Privileges or
Unrestricted View Privileges.
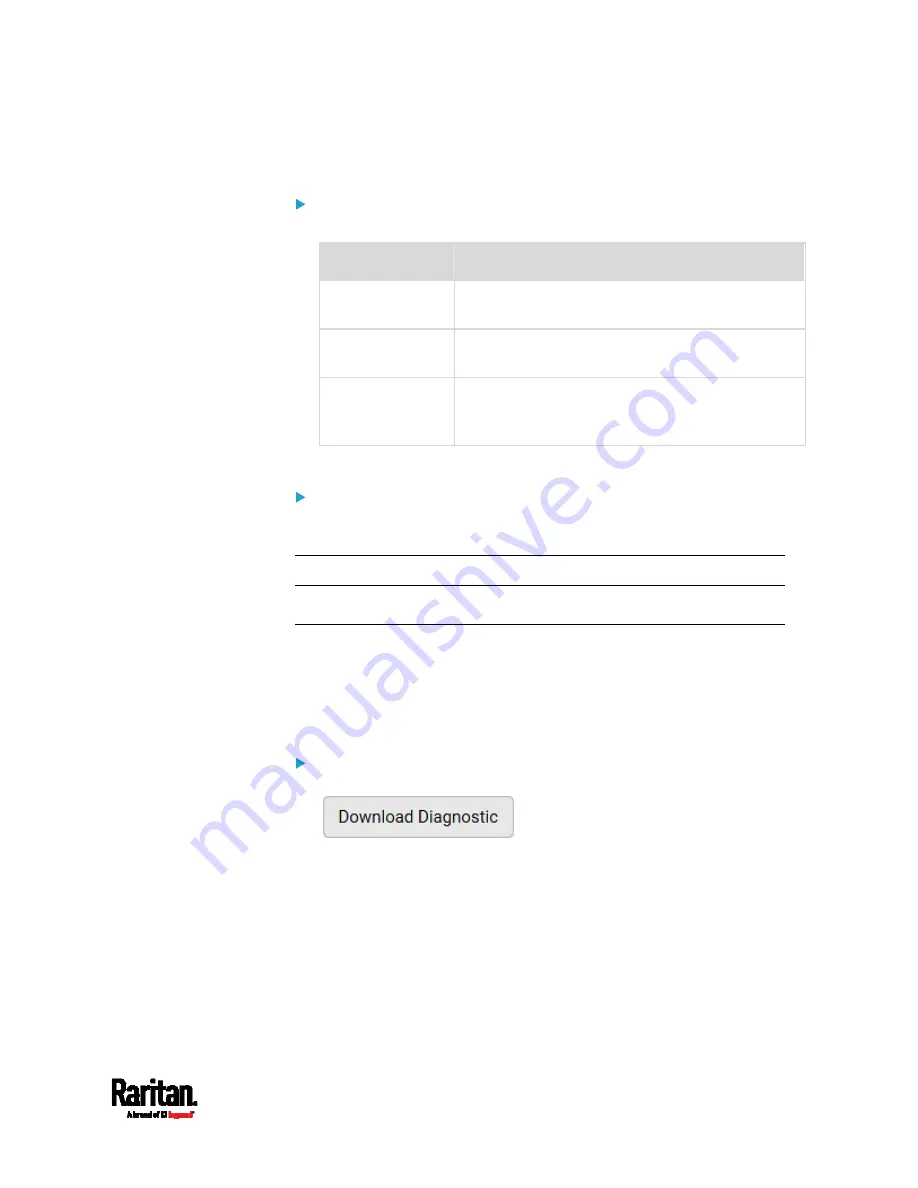
To retrieve a diagnostic file:
1.
Choose Maintenance > Download Diagnostic >
.
2.
The system prompts you to save or open the file. Click Save.
3.
E-mail this file as instructed by Raritan Technical Support.
Содержание PX3-1000 series
Страница 5: ......
Страница 92: ...Chapter 4 Connecting External Equipment Optional 70...
Страница 668: ...Appendix J RADIUS Configuration Illustration 646 Note If your PX3 uses PAP then select PAP...
Страница 669: ...Appendix J RADIUS Configuration Illustration 647 10 Select Standard to the left of the dialog and then click Add...
Страница 670: ...Appendix J RADIUS Configuration Illustration 648 11 Select Filter Id from the list of attributes and click Add...
Страница 673: ...Appendix J RADIUS Configuration Illustration 651 14 The new attribute is added Click OK...
Страница 674: ...Appendix J RADIUS Configuration Illustration 652 15 Click Next to continue...
Страница 722: ...Appendix L Integration 700 3 Click OK...


