System Overview
R&S
®
ZVA
58
Getting Started 1145.1090.62 ─ 13
Trace List and Trace Settings
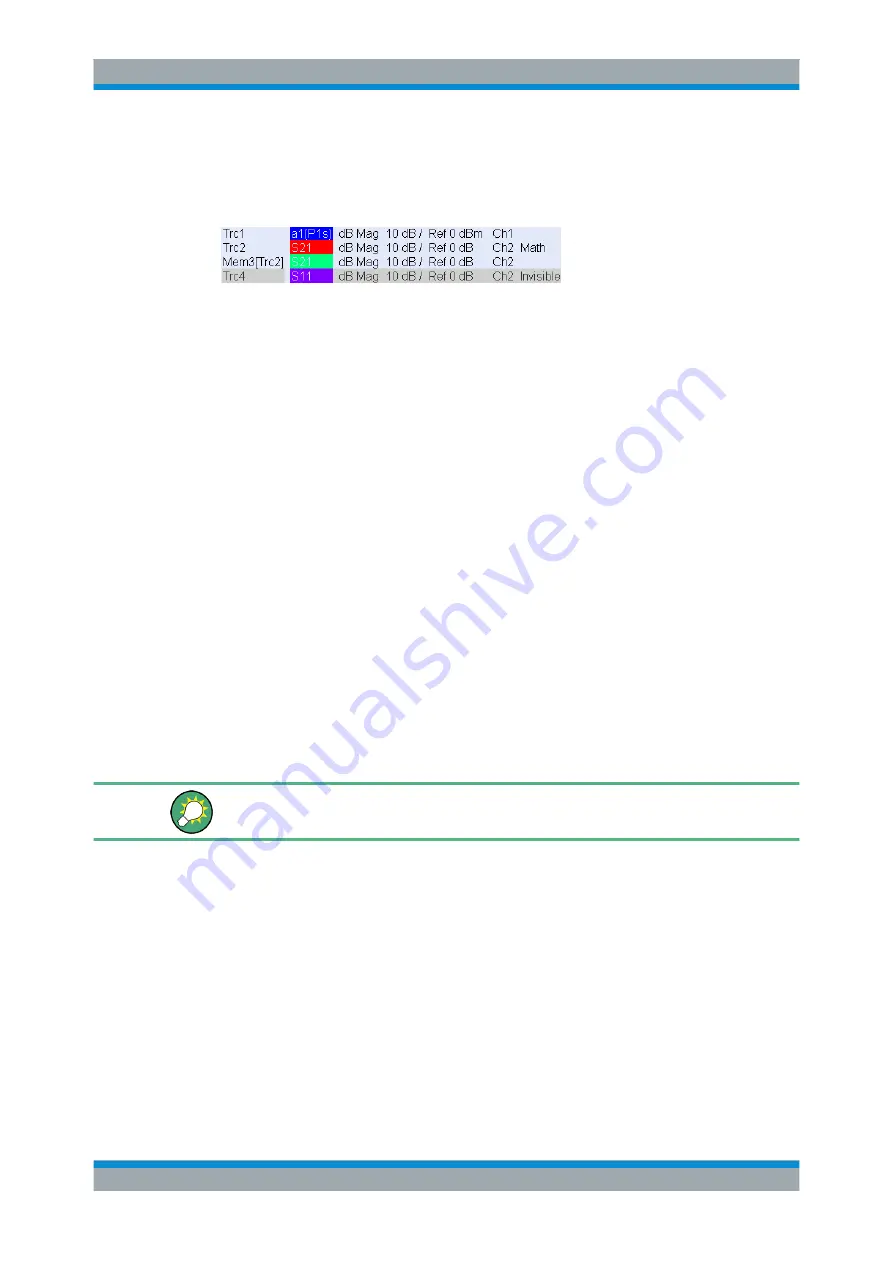
The main properties of all traces assigned to the diagram area are displayed in the
trace list in the upper left corner.
Each line in the trace list describes a single trace. The active trace is highlighted. The
lines are divided into several sections with the following contents (from left to right):
●
The
trace name
appears in the first section. The default names for new traces are
Trc<n> where <n> is a current number. A "Mem..." preceding the trace name indi-
cates a memory trace. Right-click the section and call the "Trace Manager" from
the context menu to change the trace name.
●
The
measured quantity
(e.g. an S-parameter or a ratio) appears on a colored
background. The measured quantity of the active trace is also displayed in the dia-
gram area below the trace list.
●
The
format
section shows how the measured data is presented in the graphical
display ("Trace
–
Format").
●
The next sections show the value of the vertical or radial diagram divisions ("Scale
Div.") and the reference value ("Ref").
●
The
channel
section shows the channel that each trace is assigned to. It is omitted
if the all traces in the diagram area are assigned to the same channel.
●
The
type
section indicates "Invisible" if a trace is hidden. Otherwise it indicates
–
"Math", if the trace is a mathematical trace
–
"GAT", if a time gate is active for the trace
–
"ALC", if the drive port is under automatic level control
Right-click the trace name and click "Show Data" or "Show Mem" from the context
menu to display and hide data and memory traces. Use the "Trace Funct(ions)" to
define mathematical traces.
Right-click any of the sections in the trace list (except the type section) to open a con-
text menu and access the most common tasks related to the section.
A right mouse click on the trace name, the measured quantity, and the format and
scale section of the trace list opens the following
context menus
, respectively:
Screen Elements


