Operating the instrument
R&S
®
RTO6
44
Getting Started 1801.6670.02 ─ 03
Signal bar
The signal bar is the control center for all waveforms. All enabled waveforms are
shown on the left side of the signal bar. Inactive waveforms are shown on the
right side of the toolbar. Tap an inactive waveform to enable it.
Each waveform is represented by a signal icon. If the waveform is shown in a dia-
gram, the signal icon displays its main vertical and acquisition settings. If you tap
the "Minimize" icon on the signal icon, the waveform switches from the diagram
area to the signal icon: the icon shows the real-time preview of the waveform. If
you tap a signal icon, the dialog box with vertical settings for this waveform
opens. See
Chapter 6.4, "Working with waveforms"
description.
In
, the signal icons C1 and C2 show the main settings, and the wave-
forms are displayed in diagrams. Other waveforms are minimized and shown in
the signal icon.
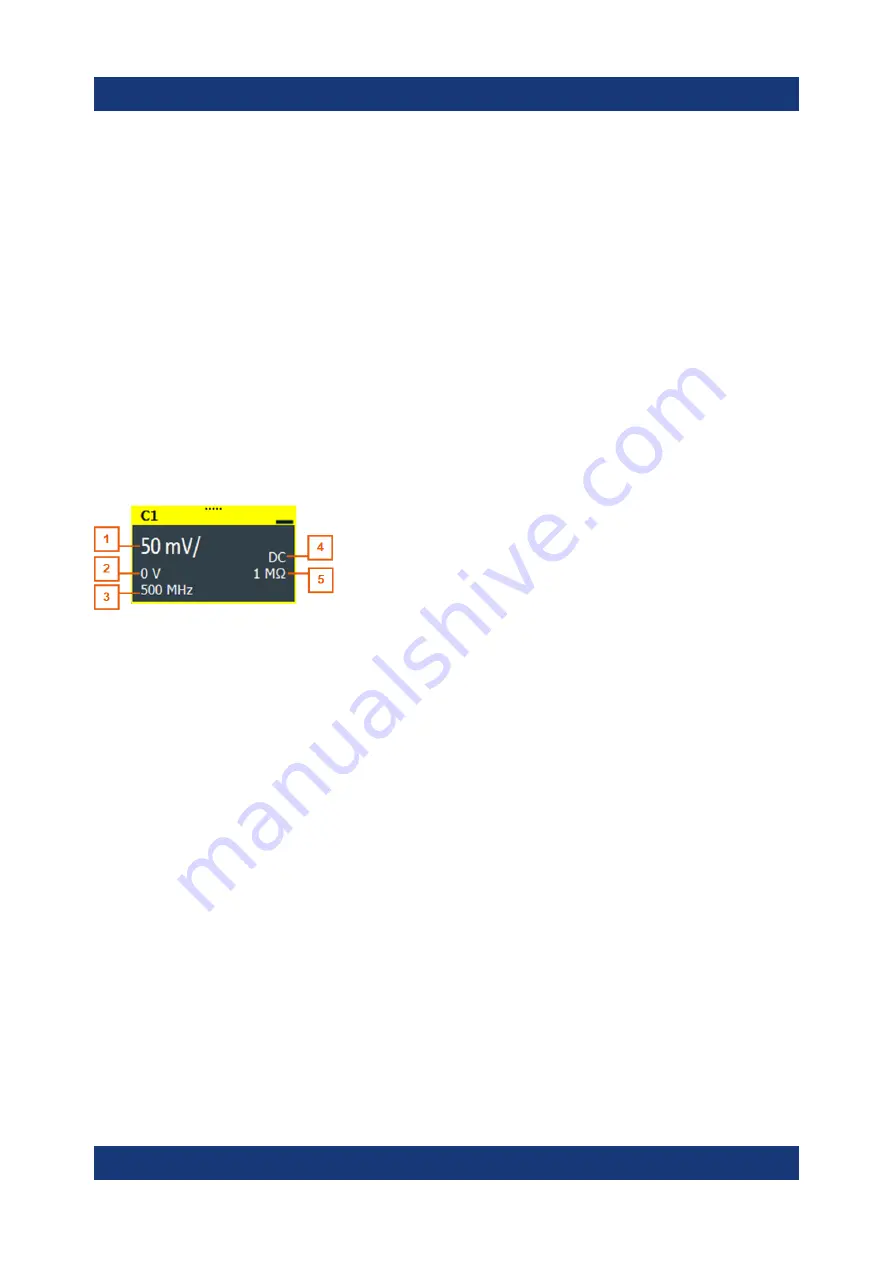
Figure 6-5: Signal label
1 = Vertical scale
2 = Offset
3 = Bandwidth
4 = Coupling
5 = Termination
If the signal bar contains many icons and not all icons are visible, touch one of the
icons and scroll left or right until the required icon appears.
You can also switch off the signal bar: "Menu" > "Settings" > "Appearance" >
"Diagram" > "Show signal bar".
Histogram and histogram area
A histogram shows the frequency of occurrence of voltage or time values in a bar
chart directly in the diagram. The rectangular histogram area indicates the part of
the waveform that is considered in the histogram. The vertical histogram counts
the voltage values, and the horizontal histogram counts time values. You can
switch between vertical and horizontal mode, and modify the histogram area by
dragging the rectangle as a whole, by dragging its edges, or by setting exact posi-
tions.
Touchscreen display