Measurements and Results
R&S
®
FSVA3000/ R&S
®
FSV3000
265
User Manual 1178.8520.02 ─ 01
width is automatically set to 10 times the analysis bandwidth. The sample detector is
used for detecting the video voltage.
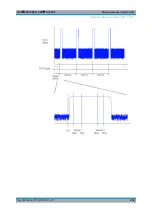
Statistic measurements on pulsed signals can be performed using a gated trigger. For
details see
Chapter 7.8.4, "APD and CCDF Basics - Gated Triggering"
7.8.2
Typical Applications
Digital modulated signals are similar to white noise within the transmit channel, but are
different in their amplitude distribution. In order to transmit the modulated signal without
distortion, all amplitudes of the signal have to be transmitted linearly from the output
power amplifier. Most critical are the peak amplitude values. Degradation in transmit
quality caused by a transmitter two port network is dependent on the amplitude of the
peak values as well as on their probability.
If modulation types are used that do not have a constant envelope in zero span, the
transmitter has to handle peak amplitudes that are greater than the average power.
This includes all modulation types that involve amplitude modulation, QPSK for exam-
ple. CDMA transmission modes in particular may have power peaks that are large
compared to the average power.
For signals of this kind, the transmitter must provide large reserves for the peak power
to prevent signal compression and thus an increase of the bit error rate at the receiver.
The peak power or the crest factor of a signal is therefore an important transmitter
design criterion. The crest factor is defined as the peak power to mean power ratio or,
logarithmically, as the peak level minus the average level of the signal. To reduce
power consumption and cut costs, transmitters are not designed for the largest power
that could ever occur, but for a power that has a specified probability of being excee-
ded (e.g. 0.01
%).
The statistical functions provide information on such signal criteria.
7.8.3
APD and CCDF Results
Amplitude Probability Distribution (APD)
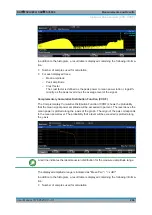
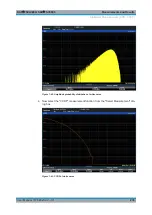
As a result of the Amplitude Probability Distribution (APD) function, the probability of
measured amplitude values is displayed. During a selectable measurement time all
measured amplitude values are assigned to an amplitude range (
bin
). The number of
amplitude values in the individual ranges is counted and the result is displayed as a
histogram. Each bar of the histogram represents the percentage of measured ampli-
tudes within the specific amplitude range. The x-axis represents the amplitude values
and is scaled in absolute values (dBm).
The size of each amplitude range (bin) determines the resolution of the histogram and
is indicated in the channel bar, for example
/
0.10
dB
. In this case, a single bar in the
histogram represents an amplitude range of 0.10
dB.
Statistical Measurements (APD, CCDF)

