Creating Graph Sets for Display - Quick Graphs
Previously, we graphed data by placing the mouse cursor over the desired data channel and left clicking.
Often times, users will find the need to graph the same set of channels, each time data is reviewed. It is
possible to create graph sets that when selected, will automatically graph the desired channels in a
desired color. These files are called Quick Graphs. To create a Quickgraph:
Erase all graphs by double clicking the Clear All Graphs icon
Graph the desired channels, in the desired colors.
At this time, we have pre-set the channels and colors we wish to save as a Quick Graph. To name and
save the Quick Graph:
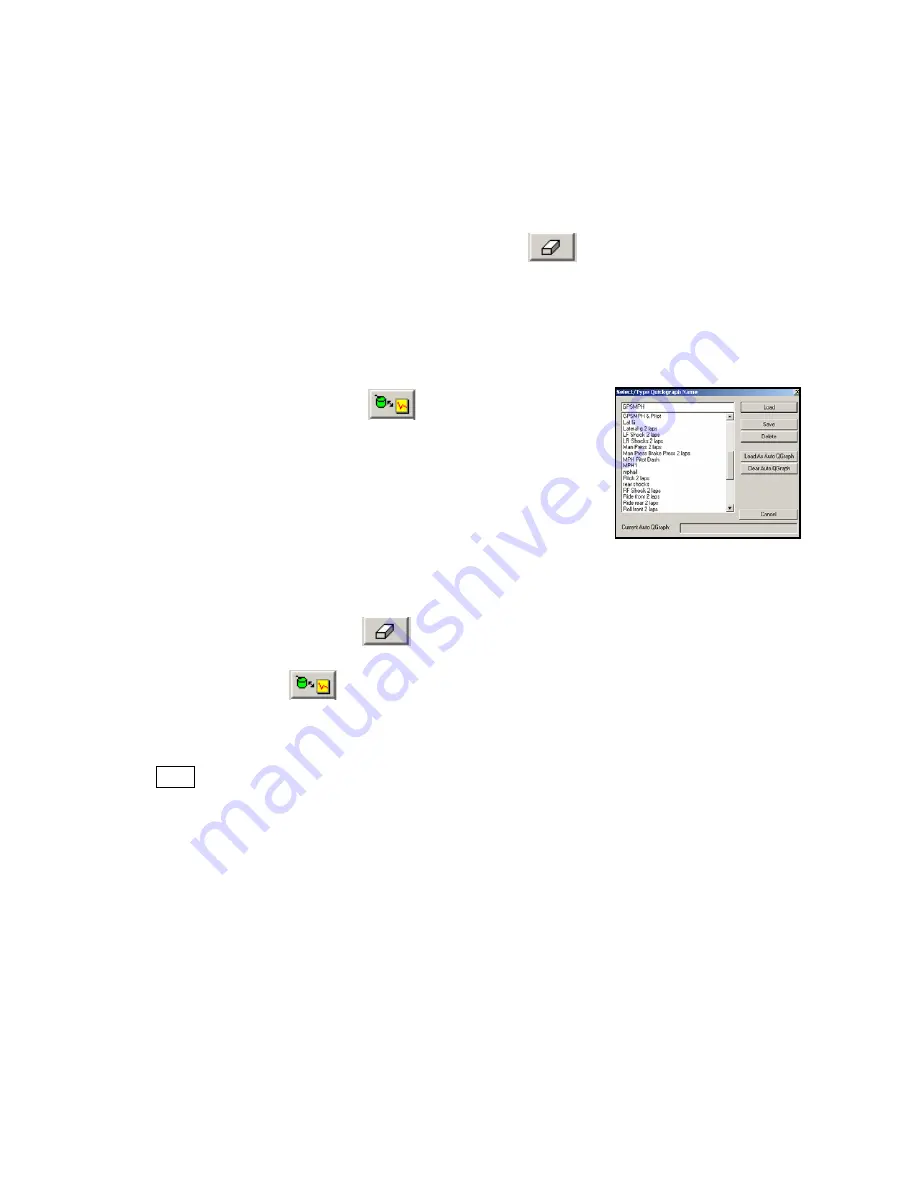
Select the Quick Graph icon in the
DataLink toolbar.
Enter a name for the Quick Graph. For this example, we used
GPS_MPH.
Click on the Save button to save for later use.
We have now created and saved a Quick Graph. To recall a graph set for use:
Double click the Clear all Graphs icon
in order to remove all graphed data from the Main Graph
area.
Select the Quick Graph icon
in the DataLink toolbar.
Select the desired Quick Graph name.
Select the Load button.
The graphed data should automatically load, into the Main Graph area.
69


