


ー
103
ー
Operating Instructions
Intelligent Controller
11
4
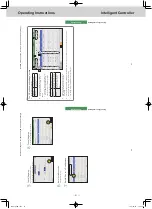
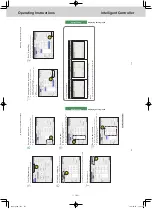
Displaying data in graphs
Energy saving
5
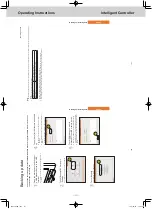
Touch [DispItem set].
z
The “DispItem set” screen is displayed.
5
6
Select how to display
.
z
Refer to P
.106 for information about how to display
.
6
(The following explains using examples as if “ItemUnts” was selected)
7
Select the unit.
z
Refer to P
.106 for information about units.
7
8
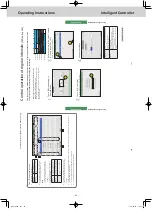
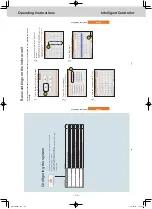
Select the type of data.
z
Refer to P
.107 for information about types of data.
z
If you have selected [days] for the display period, this is not set.
8
9
Select the item.
z
Refer to P
.107 for the items you can set.
z
You can select one item only
.
z
If you have selected [By unit] as the display method, the
items are fixed so there is no need for you to set them.
9
10
Select the device name.
z
You can set the device name for only one device.
z
If you have selected [ItemUnts] as the display method, you can set up to 4
device names.
10
Continued on next page
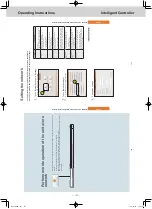
Graphing temperature changes
11
5
Displaying data in graphs
Energy saving
11
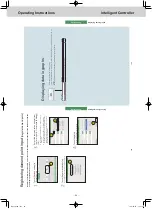
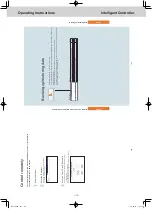
Set the goal values for the axis.
z
Touch [Ax1TgtV
al] and enter the numbers with the
touchscreen numeric keypad.
z
A red line is inserted to indicate the goal values for the graph.
z
You can set any goal.
11
12
Touch [GraphDsp].
z
The graph is displayed in the main screen.
z
To cancel the settings, touch [Cancel].
12
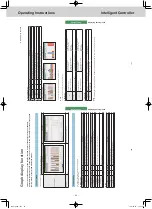
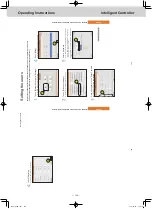
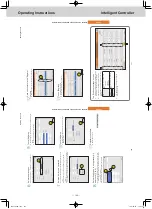
Line graph example
Display method
By unit
ItemUnts
ChngPrDy (ChngPrYr)
*1
*1
*1
*1
You can touch
to change the units displayed (10
units be
fore or after).
Note
y
Touch [Graph Disp.Set.] to change the display range and displayed items.
Graphing temperature changes
TGR-318_ENG.indb 103
2017/04/06 10:43:47