


ー
100
ー
Operating Instructions
Intelligent Controller
108
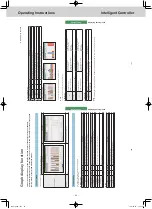
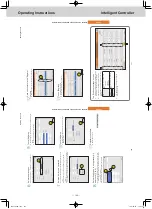
Displaying data in graphs
Energy saving
[UserSlct]
z
“Setting items freely” (P
.1
16)
When you select [UserSlct] for both bar charts and line graphs, you can display graphs where you can freely select the units an
d items. By
registering the settings in “Graph group” to suit their use, you can easily display them without having to select the items eve
ry time. (Y
ou still
need to set the display period and other items.) Up to 5
graph groups can be registered.
Example
The monthly transitions of total operating hours, thermostat ON operating times, and electricity usage for one indoor unit is registered in graph group
1.
Example
The daily transition of operation cycles and engine operating times for 2 outdoor units is registered in graph group
2.
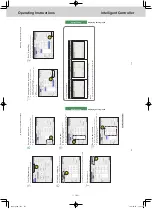
Graph display function
109
Displaying data in graphs
Energy saving
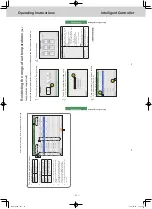
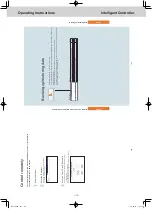
Graphing operating times and energy usage
Specify the display period (daily
, monthly
, yearly), and display mainly accumulated data, such as energy
usage (electricity
, gas), total operating hours, and charges (electricity
, gas), in bar charts.
You can put target values in graphs (these are displayed as red lines on the graphs). Putting target values in the graphs will help raise awareness about saving energy
.
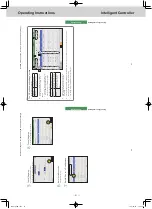
1
Touch [Energy saving mgmt] in “EnergySaving”.
1
2
Touch [Bar chart].
z
The main screen is displayed.
2
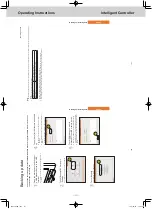
3
Touch [GrphDspSetgs].
z
The display settings screen is displayed.
3
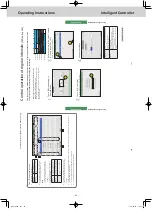
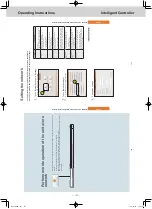
4
Set the display range.
(The screen shown is if “days” is selected)
Item
Explanation
Display period (days/Mths/Yrs.)
Refer to P
.106 for information about display
periods.
DspDay DspMth Year
Set the dates to be displayed.
y
When “days” is selected
1) T
ouch
.
2)
Select the date to display in the “Calendar” dialogue.
The current date is displayed if you touch [Tday].
y
When “Mths” or “Yrs.” is selected
1)
Select the month or year to display with
.
The current month or year is displayed if you touch [CuMo] or [CuYr].
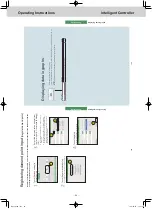
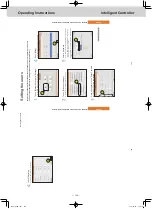
X-axis
Use
to set the first and last t
ime
or period.
y
When “days”, 00:00 to 24:00 in 1-hour steps
y
When “Mths”, 1st to 31st in 1-day steps
Data units
Indicates the units for one tick mark on the X axis.
days: Fixed at 1
hour
Mths : Fixed at 1
day
Yrs.: Fixed at 1
month
Y-axs1 Lt Y-axs2 Rt
Set the range of values for the axis. If you put a check mark in “AutoAjst” the values will be set automatically to the maximum value and the minimum value. If you want set the maximum and minimum values manually
, remove the check mark and
enter the values in the text box.
Continued on next page
TGR-318_ENG.indb 100
2017/04/06 10:43:42