


ー
99
ー
Operating Instructions
Intelligent Controller
106
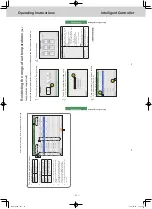
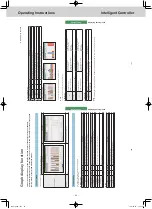
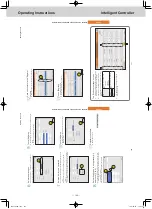
Displaying data in graphs
Energy saving
Graph display function
This unit is equipped with a “graph display” function as part of the energy saving functionality
.
Collect data from devices such as the indoor units, outdoor units, and pulse meters, set the display period (daily
, monthly
, or yearly) and display the graphs.
Types of graph
There are 2
types of graph that you can display on this unit.
Bar charts
Line graphs
Display example
Main uses
Comparing accumulated data (thermostat ON operating times, etc.)
Comparing temperature changes, etc.
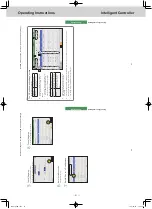
Graph settings
The following settings are necessary to display graphs. (
are items that can be set)
Display period
Display period
Bar
Line
Explanation
days
The transition of daily data is displayed in hourly units (1
hour).
Mths
The transition of monthly data is displayed in daily units (1
day).
Yrs.
The transition of yearly data is displayed in monthly units (1
month).
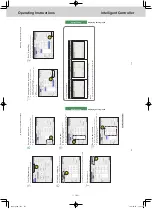
Display method
Display method
Bar
Line
Explanation
Ranking
Display the 10
top best or worst units based on collected values for the item.
By unit
Data by item is displayed for units. (items are fixed)
UntCmpar
Display the data for items by unit (you can select up to 4
devices).
ItemUnts
ChngPrDy
The three days’
worth of data for items and units from the day before the previous day
, the previous day
, and the
same day is displayed.
UserSlct
You can select items freely
.
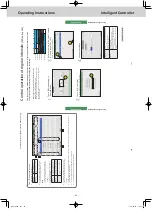
Unit
Unit
Bar
Line
Explanation
I/D
Set indoor unit as the display target.
O/D
Set outdoor unit as the display target.
Pulse
Set accumulator (pulse meter) as the display target.
A
r.
Set area group as the display target.
107
Displaying data in graphs
Energy saving
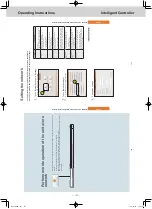
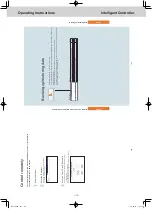
Graph type/Data type
Type
Bar
Line
Explanation
Graph
Plel*
1
Selected units or data are lined up horizontally
, with one unit on the X axis.
Cumultve*
2
Data for selected units are stack, with one unit on the X axis.
SepUnt*
3
The X axis displays the units (10
units in ascending order of display).
Data
Max.*
4
The highest value of the selected item is used as the data.
Min.*
4
The lowest value of the selected item is used as the data.
Avge*
4
The average value of the selected item is used as the data.
SpcfT
ime
The value of the selected item from the specified time is used a
s the data.
*1
Display example (Parallel)
*2
Display example (Stack)
*3
Display example (Unit)
*4
These can be set when “Mths” is selected as the display period.
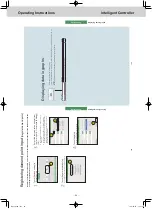
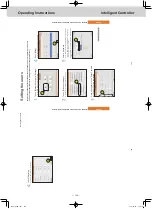
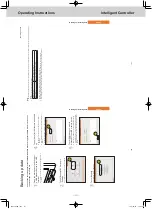
Item
The items you can set depend on the unit selected.
z
Bar charts
Unit
days
Mths
Yrs.
I/D
Ttl opr time (minutes) T/S ON ope. time (minutes)
Ttl opr time (minutes)
T/S ON ope. time (minutes)
Elec. usage (kWh)
A/C gas usage (m
3
)
PowerGenratn gas usage (m
3
)
ElectricCost
A/C gas cost
PwrGnGasCost
O/D
O/D Unit opertn count (times)
Engine operating time (minutes)
Invertr cuml power genrtn (kWh)
PV cumulatve pwr generatn (kWh)
Pulse
Incr
. amount
A
r.
Ttl opr time (minutes) T/S ON ope. time (minutes)
Ttl opr time (minutes)
T/S ON ope. time (minutes)
Elec. usage (kWh)
A/C gas usage (m
3
)
PowerGenratn gas usage (m
3
)
ElectricCost
A/C gas cost
PwrGnGasCost
z
Line graphs
Unit
days
Mths
I/D un
Set T
. (
°
C)
Room temp. (°C)
DischrgeT
emp (
°
C)
Suction temp (
°
C)
O/D un
Outdoor temp (°C)
Invertr inst power genrtn (kW)
PV InstPwGen (kW)
Note
y
If you selected [By unit] as the display method, all items are displayed for the relevant units. (Y
ou cannot select the items)
Graph display function
TGR-318_ENG.indb 99
2017/04/06 10:43:41