10 How the C-Quant works
Instruction Manual C-Quant ( G/80000/1007/en)
27 / 56
9.1.5
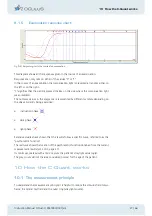
Examination response chart
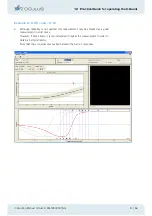
Fig. 9-9: Responses given in the course of an examination
This diagram shows all the responses given in the course of an examination.
Responses can only take on either of the values "0" or "1".
In the course of an examination the compensation light is presented at random either on
the left or on the right.
"1" signifies that the patient pressed the key on the side where the compensation light
was presented.
The outcome values in the diagram are represented by different symbols depending on
the phase currently being examined.
instruction phase
dark phase
light phase
Extensive studies have shown that the results follow a specific curve, referred to as the
"psychometric function".
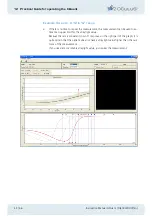
The red curve shows the location of the psychometric function obtained from the current
measurement results (sect. 10.3, page 31).
Its minimum, marked with a red dot, gives the patient’s straylight value log(s).
The gray curves delimit the area considered normal for the age of the patient.
10 How the C-Quant works
10.1 The measurement principle
To understand the measurement principle it is helpful to reduce the stimulus field to two
fields: the central test field and the outer ring (straylight source).


