


Viewing Channel Usage
21
V.
V
IEWING
C
HANNEL
U
SAGE
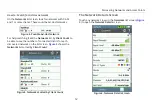
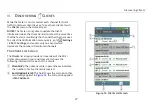
Figure 10. Channels Utilization Screen
The Channels Utilization Screen
From the Home Screen, touch
Channels
to open the
Channels Utilization
screen, which provides an overview of
all channels and their APs.
AirCheck G2 calculates and records the average
802.11
and
Non 802.11
channel utilization for each channel per each
scan. Discrete channel utilization measurements begin when
you power on and update with each scan.
Bands:
By default, the Tester scans channels on the
2.4 GHz
and
5 GHz
bands. To change the bands for this
function, go to
Settings >
802.11 Settings > Bands
.
Channel Number:
The channel corresponding with the
bar graph above it.
Bar Graphs and Dots:
The bar graphs show how
much of the channel capacity is used by 802.11
devices (
blue
) and by non-802.11 interference
(
gray
). The taller the bar, the noisier the channel.
The
dark blue
dots in the bar graphs show how
many access points are using the channel as the
primary channel. The numeric value above the
dots also indicates the number of APs discovered
on that channel. In the example to the left,
Channel 11 has six APs.


