UC-7400-LX Plus User’s Manual
Programmer’s Guide
5-4
The following cross compiler tools are provided:
ar
Manage archives (static libraries)
as Assembler
c++, g++
C++ compiler
cpp C
preprocessor
gcc C
compiler
gdb Debugger
ld Linker
nm
Lists symbols from object files
objcopy
Copies and translates object files
objdump
Displays information about object files
ranlib
Generates indexes to archives (static libraries)
readelf
Displays information about ELF files
size
Lists object file section sizes
strings
Prints strings of printable characters from files (usually object files)
strip
Removes symbols and sections from object files (usually debugging information)
Debugging with GDB
Before you debug with GDB, you must compile your program with the option -ggdb. Use the
following steps to do this:
1.
To debug a program called
hello-debug
on the target, use the command:
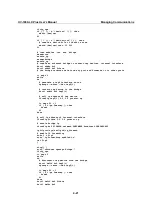
#gdbserver 192.168.4.142:2000 hello-debug
This is where 2000 is the network port number on which the server waits for a connection
from the client. This can be any available port number on the target. Following this are the
name of the program to be debugged (hello-debug), plus that program’s arguments. Output
similar to the following will be sent to the console:
Process hello-debug created; pid=38
2.
Use the following command on the host to change to the directory that contains
hello-debug
:
cd /my_work_directory/myfilesystem/testprograms
3.
Enter the following command:
#ddd --debugger xscale_be-gdb hello-debug &
4.
Enter the following command at the GDB, DDD command prompt:
Target remote 192.168.4.99:2000
The command produces another line of output on the target console, similar to the following:
Remote debugging using 192.168.4.99:2000
192.168.4.99 is the machine’s IP address, and 2000 is the port number. You can now begin
debugging in the host environment using the interface provided by DDD.
5.
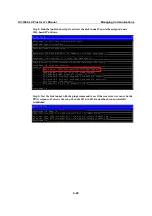
Set a breakpoint on main by double clicking, or entering b main on the command line.
6.
Click the
cont
button


