background image

USB-5100 Series Software Help 

Reading Out, Plotting, and Analyzing Data 

31 


Use the Arrow tool to point to and select items on the graph to edit their properties (through a right-click 
menu). 


Use the Crosshair tool to zero in on a specific date and time in the plot and any data points associated with 
that date and time. Click the Crosshair icon and then place your cursor anywhere on the plot to draw a red 
vertical line at a particular point. 


Use the Hand Drag tool to move different areas of the graph into view (panning) or to adjust the position of 
one series so it can be viewed more easily. This is particularly useful when you are zoomed into the graph 
and want to see another section of the graph without zooming out and then zooming back in on the new 
location. 


Use the Zoom tool to focus on one area of the graph, allowing you to see more detail. 

Actions 

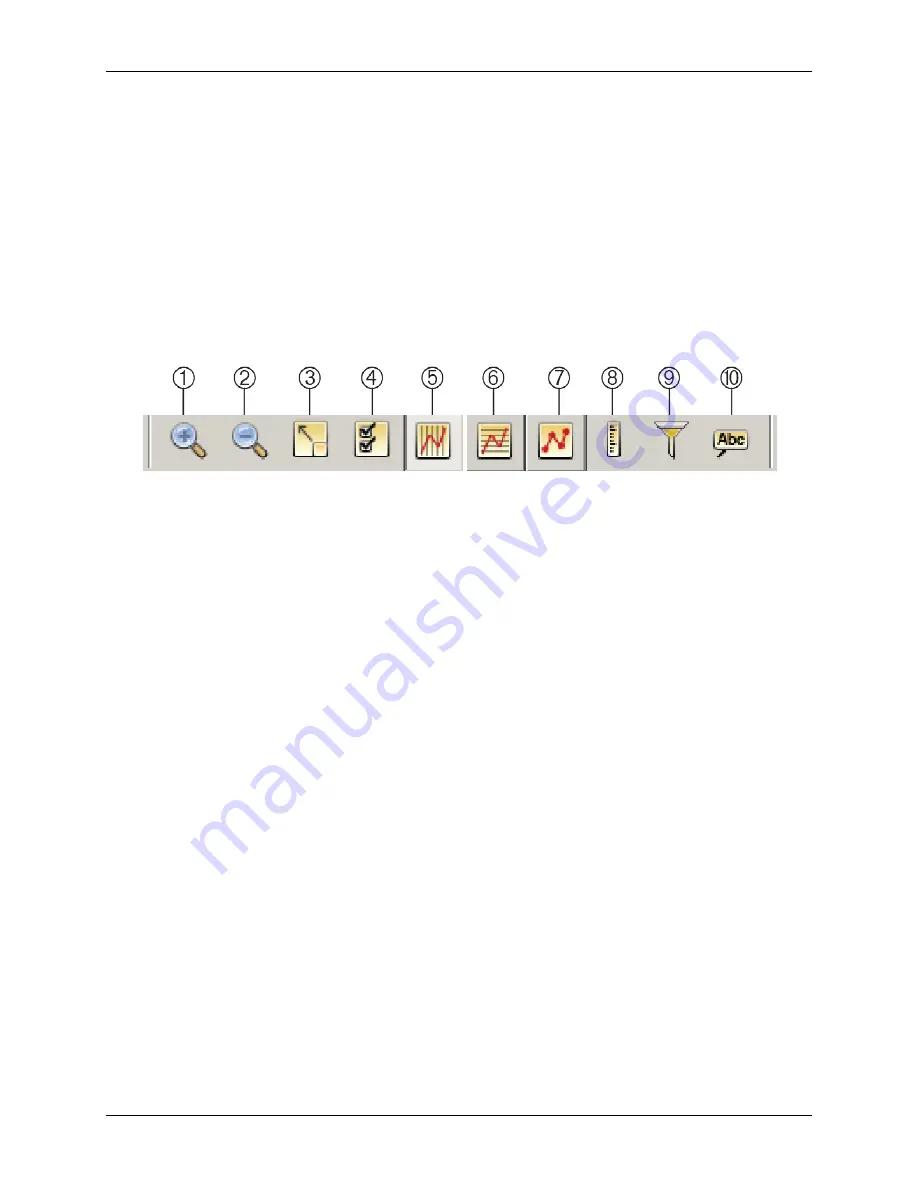
Use the Actions buttons on the toolbar to perform a number of actions on a plot or a series. 


Zoom In button 

Toggle all horizontal gridlines on/off button 

Zoom Out button 

Toggle point markers on/off button 

Show Graph at Full Scale 

Convert units for all series button 

Graph Properties button 

Filter Series button 

Toggle all vertical gridlines on/off button 

10 

Add Graph Label button 

Figure 17. Actions Buttons 


Click the Zoom In/Zoom Out buttons to keep the plot centered as you zoom. 


Click the Show Graph at Full Scale button to return to the original, full-scale version of the plot when the 
data file was first opened. 


Click the Graph Properties button to open the 

View Properties

 dialog box the plot element that is currently 

selected, such as axis, series, legend, or title. 


Click the Gridline buttons to toggle all horizontal or vertical gridlines on and off. You can also toggle 
gridlines on and off for each axis individually. Using the arrow tool, double-click an axis to get the 

Axis 

Properties

 dialog box. Select or clear the 

Show Gridlines

 checkbox to toggle the gridlines for that axis. 


Click the Point Markers button to toggle the point markers for all series on and off. To show or hide 
markers for an individual series, right-click the series to open the 

Series Properties

 dialog box. Select or 

clear the 

Mark Points

 checkbox to toggle the markers for that series. 


Click the Convert Units button to open the 

Convert Plot

 dialog box, which allows you to convert the units 

on certain series on the plot to other units (for example, from degrees Fahrenheit to degrees Celsius). 


Click the Filter Series button to open the 

Filter Series

 dialog box and add a statistical series to the plot. 


Click the Add Graph Label button to open the 

Graph Label Properties

 dialog box. 

Menus 

Use the 

Edit

 and 

View

 menus to access various controls when working with a plot. You can also right-click an 

element in the plot to access many of the same options available from the 

Edit

 and 

View

 menu and to open 

properties dialog boxes. 


Содержание USB-5100 Series

Страница 1: ...USB 5100 Series USB Data Loggers for Windows and Mac Software Help Document Revision 6 December 2015 Copyright 2015 ...

Страница 2: ...in any form by any means electronic mechanical by photocopying recording or otherwise without the prior written permission of Measurement Computing Corporation Notice Measurement Computing Corporation does not authorize any Measurement Computing Corporation product for use in life support systems and or devices without prior written consent from Measurement Computing Corporation Life support devic...

Страница 3: ...ice 11 Connecting Multiple Devices 11 Launching Devices 12 Launch Logger Dialog Box 12 Launch Options for USB 5100 Series Data Loggers 13 Logger Information 13 Sensors 13 Deployment 14 Options 15 Using Launch Utilities 15 Configuring a Filter Series at Launch 15 Configuring a Data Assistant Scaling 16 Configure Alarms 18 Statistics Maximum Minimum Average and Standard Deviation 20 Filtered Series ...

Страница 4: ...g a Series from a Plot 42 Copying a Series to Another Plot 42 Overlaying Series 42 Merging Files 43 Converting Units 44 Undoing and Redoing Plot Changes 45 Saving Project Files 45 Using the Linear Data Assistant USB 5106 Only 45 Default Settings 45 Hiding Assistants 45 Updating the Linear Scaling Assistant 45 License Agreement 46 Linear Scaling Assistant 46 Using the Linear Scaling Assistant 46 Ex...

Страница 5: ...tions 56 Undo Redo 56 Display Preferences 56 Default Units 56 Date Time 56 Series 57 Warnings Preferences 57 General 58 Warnings Before the Launch Screen 58 Warning After the Launch Screen 58 Restoring Default Preferences 59 Menus 59 The USB 5100 Series Menu 59 The File Menu 60 The Device Menu 60 The Edit Menu 61 The View Menu 61 The Window Menu 62 The Help Menu 62 The Toolbar 62 Setting the Langu...

Страница 6: ...s buttons text boxes and check boxes italic text Italic text is used for the names of manuals and help topic titles and to emphasize a word or phrase Where to find more information Additional information about USB 5100 Series is available on our website at www mccdaq com You can also contact Measurement Computing Corporation with specific questions Knowledgebase kb mccdaq com Tech support form www...

Страница 7: ...oad the USB 5100 Series for Windows from www mccdaq com software aspx 2 Run the USB 5100 Series_Setup exe installer file and follow the onscreen instructions The Java Runtime Environment is required If the correct Java Runtime Environment version is not already installed on your computer the setup program asks if you want to install it Click Yes and follow the prompts After the Java Runtime Enviro...

Страница 8: ...Series Window This example shows a file that has been opened and plotted There are three components to a plotted data file the Points Table the Details Pane and the Plot The Points Table The Points Table lists data points values and logged events displayed in the plot The Points Table is linked to the graph only the data for the series and events on the plot are listed in the Points Table Figure 2...

Страница 9: ...yment number start time and time zone logging interval and battery voltage at launch Series statistics such as the total number of sensor samples and events time of the first and last sample and the maximum minimum average and standard deviation for each sensor series in the plot Figure 3 Details Pane Click to expand or to collapse an entry in the Details Pane Click Show All Hide All to expand or ...

Страница 10: ...ists the keys line colors and marker types for each series and is displayed to the right of the plot by default If the crosshair tool is in use it also lists the date time and point values currently selected by the crosshair Figure 4 Plot Display To hide the title clear the View Title checkbox To hide the legend clear the View Legend checkbox Double click a plot element series axis title or legend...

Страница 11: ...window Note Windows only If the device has never been connected to this computer before it may take some time for the computer to detect the new device and report that it has connected successfully One or more messages display indicating that new hardware has been found You may also hear a chime Your computer may prompt you to reboot before you can use the device It is not necessary to reboot Conn...

Страница 12: ...ided into the following three panes Logger Information The name of the logger currently selected displays at the top of this pane along with the serial number deployment number and current battery level Use the Description field to enter a name up to 40 characters for the logger deployment The description is used as the default file name when you read out the logger and save the data It is also th...

Страница 13: ...logger Status button Click Status to display the logger settings from the previous launch Sensors The Sensors list displays all sensors available to record data Choose the sensors channels that you want to log in this deployment and select the appropriate sensor type from the listbox Enter a label for the sensor as needed To change temperature units select File Preferences Display Default Unit Sys...

Страница 14: ...n and the more memory is required Once you launch the logger the selected statistics are displayed on the logger LCD Statistics logging is not available for the internal temperature channel If you select Burst or Statistics logging an Edit button displays next to Logging Mode in the Launch Logger dialog box Click this button to make additional changes as necessary If you select Normal or Statistic...

Страница 15: ...ns Turn LCD off Configure the logger to operate in stealth mode with the LCD screen turned off You can override this temporarily by pressing the Start Stop button on the logger to turn the LCD on for 10 minutes Important After you choose the launch settings in this dialog box and click Start the settings are then loaded into the logger The LCD screen on the logger does display LOAD during this pro...

Страница 16: ...e the GMT offset for the filtered series the data points do not reflect that change They do continue to be filtered based on times within the original GMT offset at launch See Filtered Series vs Statistics Logging for more information Configuring a Data Assistant Scaling When you run a Data Assistant from the Launch Logger dialog box you can create a derived series which is an additional data seri...

Страница 17: ...Figure 7 Linear Scaling Assistant Example 5 Create additional scaled series as needed To change a derived series either double click the derived series name or select it and then click Edit To delete a derived series select the series and then click Delete 6 After you finish creating editing or deleting one or more derived series click Done The total number of derived series created appears on Sca...

Страница 18: ...ed value complete the following steps 1 Click Alarms in the Launch Logger dialog box If the Alarms button is disabled make sure the Logging Mode is set to Normal or Statistics Alarms are not available for USB 5100 Series loggers when the Logging Mode is set to Burst 2 In the Alarms dialog box select the sensor that you want to have an alarm Figure 8 Filter Series Dialog Box ...

Страница 19: ... option for the Sensor Alarm Mode o Cumulative The alarm trips after the set number of samples are outside the limits the high or low samples do not need to be consecutive o Consecutive The alarm trips after a specific number of samples based on the Number of out of range samples displayed setting outside the limits are logged in a row 5 Choose how long the logger should maintain the sensor alarm ...

Страница 20: ...dard deviation using the samples gathered over the previous five minute period and logs the resulting value s When reading out the logger this results in five data series one sensor series with temperature logged every five minutes plus four maximum minimum average and standard deviation series Notes Statistics are not available for logging if Normal or Burst has been chosen as the Logging Mode in...

Страница 21: ...t the logger Filtered Series vs Statistics Logging USB 5100 Series loggers support filtered series and statistics logging both of which involve calculating maximum minimum and average values that you can plot after the logger is read out Both are accessed from the Launch Logger dialog box for filtered series click Filters and for statistics logging select Statistics as the Logging Mode However the...

Страница 22: ...s below 32 F the low level This means the logger records data every five minutes as long as the temperature remains between 85 F and 32 F Once the temperature reaches 90 F for example the logger does switch to the faster logging rate and record data every 10 seconds until the temperature falls back below the high level or 85 F in this case At that time logging then resumes every five minutes at th...

Страница 23: ...In this example both the high and low levels were selected You may choose only one if you wish Figure 11 Burst Logging Dialog Box 6 Configure the burst logging interval which must be less than the logging interval Select either a preset burst logging interval or select Custom and enter your own interval Keep in mind that the more frequent the burst logging rate the greater the impact on battery li...

Страница 24: ... logging at a fast logging interval or stopped To check the status of a logger complete the following steps 1 Connect the logger to the computer 2 Click the Status icon on the toolbar or select Device Status Note You can also check the status by clicking Status in the Launch Logger dialog box but this shows details from the previous launch This is an example of the Status dialog box The informatio...

Страница 25: ...nterval the scheduled start time is shown here in local time Deployment Number The number of times the logger has been launched including the most recent launch Logging Interval The rate at which the logger was set up to record data If multiple logging intervals are available the interval currently in use if the logger is logging is shown in bold Sampling Interval The rate at which sensors are sam...

Страница 26: ...elected you can also press the Start Stop Logging button to stop logging on certain logger models In addition you can use software to stop the logger manually at any time To stop a logger complete the following steps 1 Connect the logger to the computer 2 Click the Stop icon on the toolbar or select Stop from the Device menu After the logger has been stopped the data remains in the logger until th...

Страница 27: ... Once the readout is complete choose a location and or a new filename or accept the default location and name to save the data The default location is C Users user Documents USB 5100 Series If you save the file to a different folder that folder is the new default save location for future readouts 4 Click Save Most data files have a hob extension 5 After saving the data select the sensors and or ev...

Страница 28: ...gged data series which is a series containing the sensor measurements state changes or statistics recorded by the logger o Derived series which is a series calculated based on one or more logged data series This could be a filtered series if you configured filters in the Launch Logger dialog box o Battery voltage which lists the logger battery voltage recorded at each logging interval 3 Change the...

Страница 29: ... to the left of the plot You can show or hide these elements using the View menu To organize several plots use the Window menu to switch between Tabbed View Tile Horizontally or Tile Vertically Figure 14 Plotted Data Notes To change the order of series displayed in the Plot Setup dialog box select File Preferences Display Series To change the series and events that are selected by default in the P...

Страница 30: ...a Plot Setup dialog box for each file unless you have set the preference to automatically plot data as described in General Preferences To open a USB 5100 Series project file hproj complete the following steps 1 Select File Open Project 2 Select a project file and click Open Recently opened files are listed in the File menu Select File Recent Files and then choose the file to open To empty the rec...

Страница 31: ...tered as you zoom Click the Show Graph at Full Scale button to return to the original full scale version of the plot when the data file was first opened Click the Graph Properties button to open the View Properties dialog box the plot element that is currently selected such as axis series legend or title Click the Gridline buttons to toggle all horizontal or vertical gridlines on and off You can a...

Страница 32: ...lete the following steps 1 Select File Preferences Plotting Points Table Details Pane 2 Clear the When selected value in table is out of plot range drag series to that value checkbox The plot changes in several ways when the crosshair is in use The Points table shifts to the row that contains the data point Where the crosshair intersects a data point a square surrounds the data point The intersect...

Страница 33: ...t work on an axis that is locked To unlock an axis double click the axis with the arrow tool and clear the Lock Axis Scaling and Tick Marks checkbox in the Axis Properties dialog box Panning Use the hand drag tool or press H to pan the graph Panning is especially useful when you are zoomed into a detailed plot and want to focus on a different area without zooming out Click and hold within the grap...

Страница 34: ...u do not want USB 5100 Series to prompt you to save the plot as a project file when you close it complete the following steps 1 Select File Preferences Warnings General 2 Clear the Prompt me if there is any remaining unsaved data when closing plot or application checkbox Printing Plot Elements Printing a Graph To set up the page for printing the graph complete the following steps 1 Select File Pag...

Страница 35: ...ting Series Properties Setting Legend Properties Setting Title Properties Setting View Properties Select File Preferences Plotting to modify the following plotting preferences that control the global properties for all plots Show or hide the Points table by default Show or hide the Details pane by default Include the sensor label in the Points table and Details pane by default Customize series lin...

Страница 36: ...t to major tick marks and minor tick marks are not numbered To change the default tick marks select Custom Tick Marks and then choose the values for Major and Minor tick marks as desired 5 Change the default bounds used on each axis For the time axis select the dates and times you want the axis to display For the value axis type the minimum and maximum value you want the axis to display 6 You can ...

Страница 37: ...for the temperature series automatically changes to C instead of the custom degrees unit that you had entered 4 Adjust the appearance of the lines with the following options o Connect Points This controls whether the plotted data points in the series are connected with a line o Style This changes the appearance of the line used to connect the points in a series o Width This changes the width of th...

Страница 38: ... list to create your own o Color This changes the color used for the series 8 Click Apply to update the plot and keep the Series Properties dialog box open Click Done to update the plot and close the dialog box Setting Legend Properties To change the Legend properties complete the following steps 1 Double click the Legend or right click the plot with the arrow tool and select Other Graph Items Leg...

Страница 39: ...pdate the plot and close the dialog box Setting View Properties To change the View properties for the plot complete the following steps 1 Right click the plot and select View Properties 2 In the View Properties dialog box select the Show Legend checkbox if you want the Legend to be displayed on the plot Clear this checkbox if you do not want to see the Legend on the plot Figure 22 View Properties ...

Страница 40: ...to described the preferred location of the label relative to the labeled point 4 Important This indicates the preferred location of the label space permitting with respect to the data point it references This is only available when the label is attached to a series 5 Adjust the appearance of the label with these options o Draw Label Over Colored Background Select this checkbox if you want the labe...

Страница 41: ... legend To change the order of the series complete the following steps 1 Select the arrow tool 2 Select the series you wish to move 3 Right click and select either Bring Series to Front or Send Series to Back Filtering a Series You can filter data from existing series in the plot to create a new statistical series showing calculated data such as average minimum and maximum values over a specified ...

Страница 42: ... a series from a plot complete the following steps 1 Select the arrow tool from the toolbar 2 Click the series you wish to remove and press Delete or right click the series and select Remove 3 A warning appears indicating that the only way to add the series back to the plot is to reopen the plot Click Yes The series is removed from the graph the Details pane and the Points table Copying a Series t...

Страница 43: ...bounds should include the period of interest for the series and be the same length as the longest period identified in the original time axis in the destination plot Repeat for each time axis 12 Use the hand drag tool on each time axis to adjust the series horizontally as needed Merging Files This feature allows you to combine multiple data files into one file Note that only series of the same typ...

Страница 44: ...s Table is regenerated and does show samples of both series in one column The new logger information is added to the Details Pane showing the specific information about the different loggers that collected the data samples Converting Units Plots display data points in either SI or US units as defined within the Preferences File Display Default Unit System You can switch between SI C and US F units...

Страница 45: ...e your current data with a customized view of the plot click the Save icon on the toolbar or choose Save Project from the File menu To open an existing project file choose Open Project from the File menu Using the Linear Data Assistant USB 5106 Only You can run the Linear Scaling Assistant LSA from the Launch Logger dialog box to create additional data series that are automatically available each ...

Страница 46: ...ollowing sensors CABLE 4 20 mA Input Cable CABLE ADAPx Using the Linear Scaling Assistant To use the Linear Scaling Assistant complete the following steps 1 At launch time Using a logger with a sensor that supports scaling at launch time click the Launch icon on the toolbar Click the Scaling button Double click the assistant name or select the assistant and click Create At plot setup Read out a lo...

Страница 47: ...ly minimum maximum and average filters to the scaled series as you would for any sensor data series Exporting Data While USB 5100 Series offers many tools for analyzing data there may be instances where you need to export data for use in other software Refer to the following for exporting data and other related topics Exporting Table Data Exporting Details Copying Points Data into Another Applicat...

Страница 48: ...abel columns in both ascending and descending order Or click a row to drag that series to a different position in the list To return to the original sort order click the Restore Order button Note that if you have the export preferences set to Use export ordering rules then the series is listed in the order defined in that preference when you click the Restore Order button If the data file contains...

Страница 49: ...ate and time 2 Select the time column from row 3 down 3 Select Format Cells 4 Select the Custom category and then select m d yyyy h mm as the type 5 Add ss or ss 000 if you used a fast logging interval to the end of the string in the Type field m d yyyy h mm ss normal logging interval m d yyyy h mm ss 000 fast logging interval 6 Click OK The seconds should be listed automatically To export the dat...

Страница 50: ... of the dialog box Figure 30 Device Identification Area Showing Firmware Version Updating the firmware Complete the following steps to update the firmware on a USB 5100 Series logger 1 Download the firmware file hex from www mccdaq com firmware and copy it to the desktop 2 Connect the USB 5100 Series logger to your computer 3 Select Help Update Device Firmware Update USB 5100 Series Firmware and c...

Страница 51: ...he device 2 When the readout is complete save the data to a hob file If you receive a Read Header Failed message again the header has probably become corrupted You can restore the header by launching the logger This resets the device launch options to factory defaults However it also causes any logged data or offloaded data from a shuttle to be lost If you receive a Read Header Failed message and ...

Страница 52: ... behavior including launching reading out opening files exporting selecting devices and more To change these settings complete the following steps 1 Select File Preferences Windows or USB 5100 Series Software Preferences Macintosh 2 Select General and then click the subcategory you want to change 3 Adjust any of the settings described below and then click OK Export Settings See Export Settings for...

Страница 53: ...eneral Export Settings 3 Change any settings described below and then click OK Export file type Select how you want exported data to be saved either to a text file csv or txt or a Microsoft Excel file xls Export table data column separator This setting controls the column separator for exported text files If you selected Excel for the export file type then this option is disabled Select Comma Tab ...

Страница 54: ...le When this setting is enabled the information that appears to the left of the plot in the Details pane series information the type of logger deployment information and so on is included in the exported file along with the sensor data This option only applies to text txt or csv file type exports not Excel It also requires that the file is saved and plotted before exporting Finally select a tab or...

Страница 55: ...ls Pane Use sensor Label if available in points table and details pane Select this preference to display the sensor label if available as added in the Launch Logger dialog box with corresponding column header in the points table and in the details pane This is especially useful if there are multiple sensors of the same measurement type in the same file When selected value in table is out of plot r...

Страница 56: ...nabled you can specify how many changes to plots are stored within USB 5100 Series If you select Number of stored undoable actions then there is a limit to the number of changes to the plots that you can undo For example if you choose to store 25 undoable actions then you can undo the last 25 changes that you made to the plots but not the 26th You can configure the software to store from 1 to 50 u...

Страница 57: ...ata but also additional derived series automatically calculated in relevant units One example is a logger with a temperature sensor The logger records a data series for temperature and calculates the minimum maximum and averages for the series the derived series based on filtering Select this option if you want any derived series to be displayed immediately following its source series in the Statu...

Страница 58: ...a triggered start This warning indicates that the logger has already been configured to launch with a push button or triggered start but logging has not begun The logger needs to be readout This warning indicates the data on theUSB 5100 Series logger has not been read out yet Warnings not supported by USB 5100 Series data loggers The logger is currently logging Station loggers only warning checkbo...

Страница 59: ...plication Support USB 5100 Series Custom defined Launch Logger dialog box menus Any custom defined Launch Logger dialog box settings such as State Description or Time Logging Interval are cleared Menus The following menus are available in USB 5100 Series USB 5100 Series on Macintosh File Device Edit View Tools Window Help The USB 5100 Series Menu The USB 5100 Series menu is available on Macintosh ...

Страница 60: ...entation for printing a plot Print Preview Select this option to preview the page for printing a plot Print Select this option to print a plot Print Details Select this option to print the Details Pane Print Points Select this option to print the Points Table Preferences Select this option to open the Preferences dialog box where you can change the default settings in USB 5100 Series See Setting P...

Страница 61: ...ws you to convert some or all of the series on the currently focused plot to other units for example from degrees Fahrenheit to degrees Celsius Note that changing the units does result in the entire plot being redrawn See Converting Units for more information Undo Action Select this option to undo the last change made to the current plot The most recent change is listed after the Undo Action menu ...

Страница 62: ... are USB 5100 Series Help Select this option to open the help system displaying the full table of contents Update Device Firmware Update USB 5100 Series Firmware Select these options to check if there are firmware updates available for your USB 5100 Series device About USB 5100 Series Select this option to see which version of USB 5100 Series you are using in Windows This option is available from ...

Страница 63: ...currently focused plot to other units for example from degrees Fahrenheit to degrees Celsius Filter Series You can create a new series based on statistical analysis of an existing series over specified periods of time Add Graph Label Opens the Graph Labels Properties dialog which allows you to add a label to the plot or to a specific series and change the appearance of that label Help Opens the He...

Страница 64: ...ed language does not appear in the list click Edit List button to add the language 4 Under the Formats tab ensure the correct Region is selected in the drop down menu Example For Spanish Spain Spanish must be first in the Language list and Spain must be selected under the Region drop down menu 4 Reopen the USB 5100 Series software ...

Страница 65: ...Measurement Computing Corporation 10 Commerce Way Suite 1008 Norton Massachusetts 02766 508 946 5100 Fax 508 946 9500 E mail info mccdaq com www mccdaq com ...

Отзывы: