Reports and Listings
Issue 1 January 1997
4-13
Traffic Reports
Purpose
To generate a Traffic Report for the current or archived period.
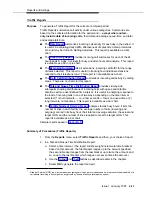
Traffic Reports summarize call activity under various categories. Summaries are
based on the collected information for the period and — except where noted —
only include data of incoming calls, their total and average queue-time, and total
and average talk-time.
The Date Report summarizes incoming call activity for each day in the period. It
is useful in evaluating daily traffic, effectiveness of sales ads, dated promotions,
etc. and may be critical in staffing decisions. This report is available as a bar
chart.
The Time of Day Report provides incoming call summaries for each of the 24
hour-bands in a day. It is ideal for busy and after-hours call analysis. This report
is available as a bar or pie chart.
The Extension Summary lists all extensions’ incoming call traffic for the range
of dates selected. This report is useful in tracking how individual extensions
respond to their telephone load. This report is not available as a chart.
The ICLID Call Distribution Report summarizes incoming call activity by calling
areas. There are no charts for this report.
The Talk and Queue Time Distribution Report provides side-by-side
subreports showing distributions of incoming calls with queue and talk-time
durations within a user-defined time interval. It is useful in analyzing response to
the load of incoming calls in one of two ways, depending on the time interval
selected: (1) short intervals — i.e., a few seconds — focus on queue-times, (2)
long intervals, on talk-times. This report is available as a bar chart.
Report analyzes facility busy hours: it lists the
number of lines in each facility, the average number of calls (incoming and
outgoing) carried in its busy hour, their total and average duration, the actual and
target GOS, and the number of lines required to meet the target GOS. This
report is available as a bar chart.
Sample reports appear in Appendix B.
Summary of Procedures (Traffic Reports)
1.
From the Reports menu, select Traffic Reports and then, your choice of report.
2.
In a Talk and Queue Time Distribution Report:
a.
Select a time interval. (The report will show eight incremental time brackets
based on this amount: the first bracket ranges up to the amount specified,
the second bracket ranges from the last bracket up to twice the amount, and
so on up to the last bracket which ranges over seven times the amount.)
b.
Use the Output and Chart buttons as described earlier in the chapter.
c.
Select OK to generate the report and exit.
*
Grade of Service (GOS) is a way to measure outgoing service on a worst case scenario: it represents the probability of a
call attempt receiving a busy signal on any given day, during a facility's (average) busy hour.
Содержание MERLIN LEGEND Reporter
Страница 1: ...MERLIN LEGEND Reporter Installation and Use...
Страница 96: ...PSU at a Polled Site Issue 1 January 1997 7 5...
Страница 121: ...Worksheets Issue 1 January 1997 A 15...

