V-Link
®
-200
User Manual
4.
Viewing Data
4.1
SensorConnect
4.1.1
Using Dashboards and Widgets
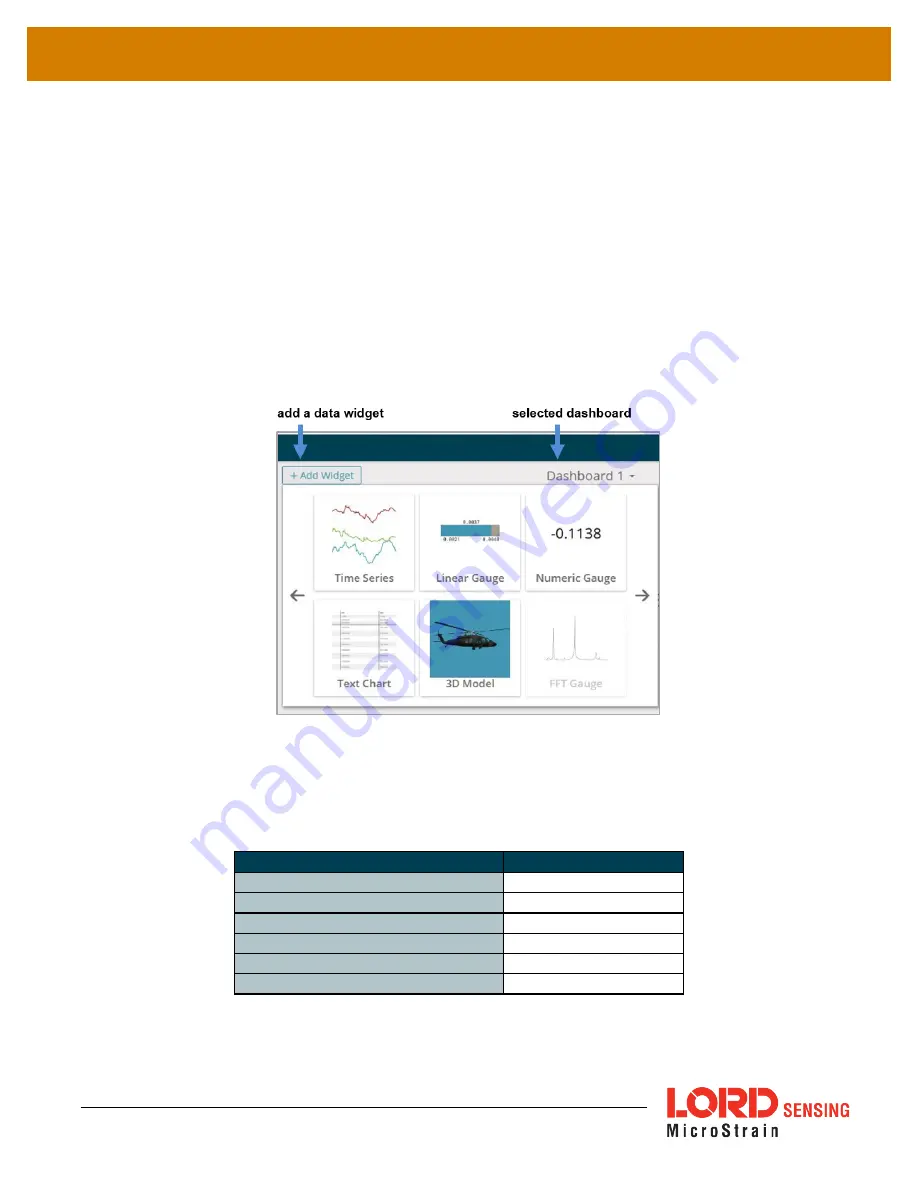
Collected data is viewed on the Data page through the creation of dashboards and widgets. Think
of dashboards as individual pages and widgets as an illustration on the page. Create multiple data
widgets on each dashboard to display sampled data as a time-series graph, text chart, or a simple
gauge that only displays the most current reading. This format provides an easy way to organize
many sensors and networks, and it allows the information to be displayed in the most appropriate
layout.
Figure 21 - Viewing Data
4.1.2
Navigating Graphs
Use the mouse along with the shift and control keys inside the graph window to adjust the data view.
Control
Action
Mouse wheel
Zoom in/out on
x
-axis
Shift + mouse wheel
Zoom in/out on
y
-axis
Mouse double-click
Zoom to extends
Shift + mouse left-click, drag left/right
Zoom window left/right
Shift + mouse left-click, drag up/down
Zoom window up/down
Ctrl + mouse left-click, drag
Zoom box
Table 2 -
Graph View Controls
28
Содержание V-Link-200
Страница 1: ...LORD USER MANUAL V Link 200 Wireless 8 Channel Analog Input Sensor Node ...
Страница 12: ...V Link 200 User Manual Figure 4 Viewing Node Diagnostic Data 12 ...
Страница 15: ...V Link 200 User Manual 15 ...
Страница 22: ...V Link 200 User Manual 22 ...
Страница 35: ...V Link 200 User Manual Figure 31 DIN Rail Mount Option 35 ...
Страница 45: ...V Link 200 User Manual Figure 36 Half and Quarter Bridge Wiring 45 ...
Страница 76: ...V Link 200 User Manual 9 Troubleshooting 9 1 Troubleshooting Guide 76 ...


