24
Rev. 0
6. Display/Hide Channels.
7. Display/Hide Trackers (minimum/maximum values,
not available for fast channel and not for accumulated
quantities like charge, energy).
8. Display/Hide Thresholds (low/high alert values, not
available for fast channel).
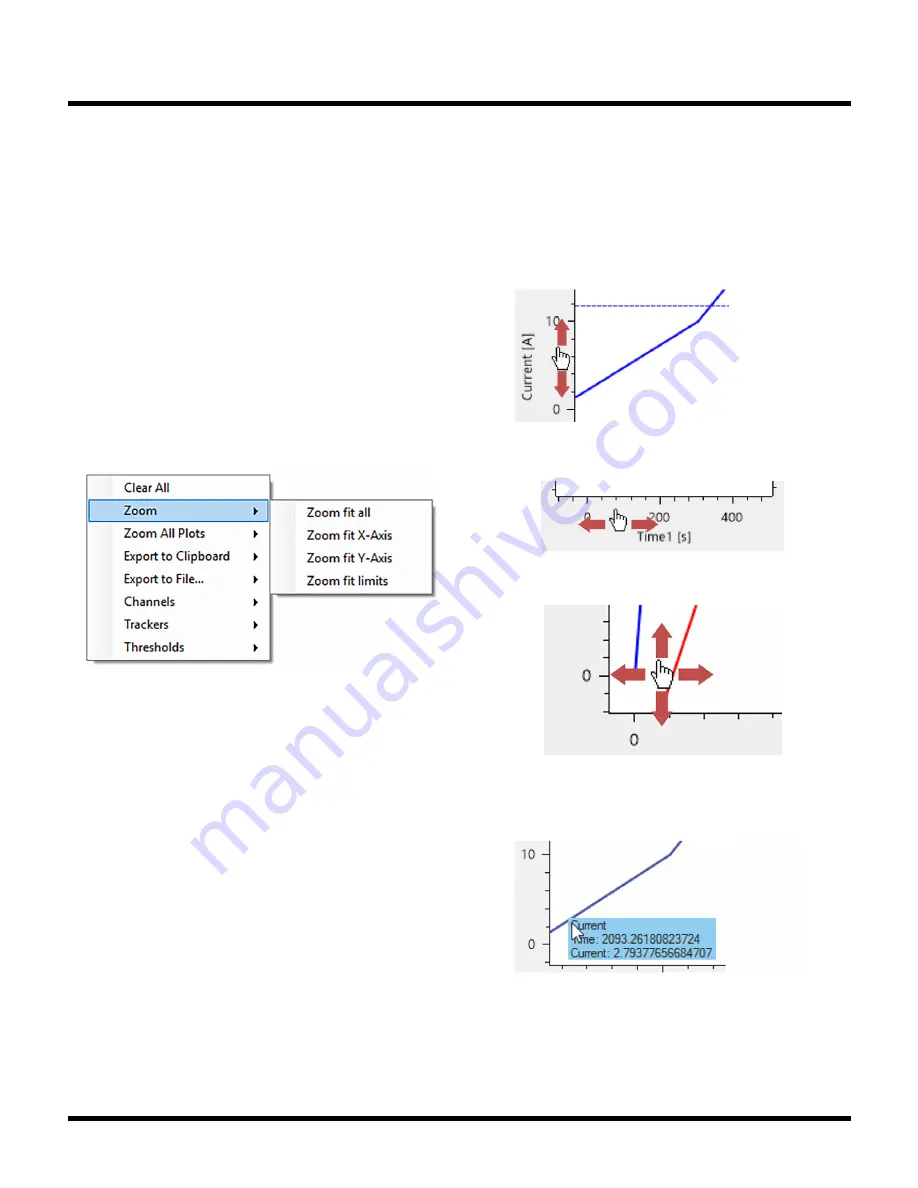
PLOT ZOOM FIT
The plots may be zoomed in different ways. “Zoom Fit
All” will fit all data except trackers and thresholds into the
plot area. “Zoom Fit X-Axis/Y-Axis” will do the same for
X/Y axis only. “Zoom Fit Limits” will again fit all axes but
will include trackers and thresholds. The latter is helpful
Figure 25. GUI: Plot Window’S Context Menu, Zoom
to show the device’s thresholds which may be far above/
below typical measurement values. The low thresholds,
for example, are set to the most negative register value.
In case of power the threshold’s low (P1TL) default value
is –7650.41 Watts (assuming 100μΩ shunt).
The Menu “Zoom All Plots” provides the same functional-
ity but applies the zooming to all plots at the same time.
PLOT PAN, ZOOM, LABELS
The following mouse gestures are supported by the
plot windows.
1. Pan vertically by right mouse clicking the Y-Axis.
2. Pan horizontally by right mouse clicking the X-Axis.
3. Pan vertically and horizontally by right mouse
clicking the plot area. This will pan the first visible
channel only.
4. Show label with data point values by left mouse click
on a data line.
5. Zoom vertically by rotating mouse wheel over
the Y-Axis.
Figure 26. Plot Pan Vertically by Right Mouse Clicking on Y-Axis
Figure 28. Plot Show Label by Left Mouse Clicking on Data Line
Figure 26. Plot Pan Horizontally by Right Mouse Clicking X-Axis
Figure 27. Plot Pan Vertically and Horizontally by Right Mouse
Clicking in Plot Area
LTC2949 WINDOWS GUI USAGE


