


Chapter 7: Using the Web Interface
437
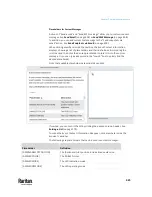
Setting Data Logging
The PX3TS can store 120 measurements for each sensor in a memory buffer.
This memory buffer is known as the data log. Sensor readings in the data log
can be retrieved using SNMP.
You can configure how often measurements are written into the data log using
the Measurements Per Log Entry field. Since the PX3TS internal sensors are
measured every second, specifying a value of 60, for example, would cause
measurements to be written to the data log once every minute. Since there are
120 measurements of storage per sensor, specifying a value of 60 means the
log can store the last two hours of measurements before the oldest one in the
log gets overwritten.
Whenever measurements are written to the log, three values for each sensor
are written: the average, minimum and maximum values. For example, if
measurements are written every minute, the average of all measurements that
occurred during the preceding 60 seconds along with the minimum and
maximum measurement values are written to the log.
Note: The PX3TS device's SNMP agent must be enabled for this feature to work.
See
Enabling and Configuring SNMP
(on page 515). In addition, using an NTP
time server ensures accurately time-stamped measurements.
By default, data logging is enabled. You must have the "Administrator
Privileges" or "Change Pdu, Inlet, Outlet & Overcurrent Protector
Configuration" permissions to change the setting.
To configure the data logging feature:
1.
Choose Device Settings > Data Logging.
2.
To enable the data logging feature, select the "Enable" checkbox in the
General Settings section.
3.
Type a number in the Measurements Per Log Entry field. Valid range is
from 1 to 600. The default is 60.
4.
Verify that all sensor logging is enabled. If not, click Enable All at the
bottom of the page to have all sensors selected.
▪
You can also click the topmost checkbox labeled "Logging Enabled" in
the header row of each section to select all sensors of the same type.
▪
If any section's number of sensors exceeds 35, the remaining sensors
are listed on next page(s). If so, a pagination bar similar to the
following diagram displays in this section, which you can click any
button to switch between pages.
5.
Click Save. This button is located at the bottom of the page.
Important: Although it is possible to selectively enable/disable logging for
individual sensors on the PX3TS, it is NOT recommended to do so.
Содержание Raritan PX3TS
Страница 4: ......
Страница 6: ......
Страница 20: ......
Страница 52: ...Chapter 3 Initial Installation and Configuration 32 Number Device role Master device Slave 1 Slave 2 Slave 3...
Страница 80: ...Chapter 4 Connecting External Equipment Optional 60...
Страница 109: ...Chapter 5 PDU Linking 89...
Страница 117: ...Chapter 5 PDU Linking 97...
Страница 440: ...Chapter 7 Using the Web Interface 420 If wanted you can customize the subject and content of this email in this action...
Страница 441: ...Chapter 7 Using the Web Interface 421...
Страница 464: ...Chapter 7 Using the Web Interface 444...
Страница 465: ...Chapter 7 Using the Web Interface 445 Continued...
Страница 746: ...Appendix A Specifications 726...
Страница 823: ...Appendix I RADIUS Configuration Illustration 803 Note If your PX3TS uses PAP then select PAP...
Страница 824: ...Appendix I RADIUS Configuration Illustration 804 10 Select Standard to the left of the dialog and then click Add...
Страница 825: ...Appendix I RADIUS Configuration Illustration 805 11 Select Filter Id from the list of attributes and click Add...
Страница 828: ...Appendix I RADIUS Configuration Illustration 808 14 The new attribute is added Click OK...
Страница 829: ...Appendix I RADIUS Configuration Illustration 809 15 Click Next to continue...
Страница 860: ...Appendix J Additional PX3TS Information 840...
Страница 890: ...Appendix K Integration 870 3 Click OK...
Страница 900: ......


