


66
Keysight CX3300 User’s Guide, Edition 5
Using the CX3300
Making a Measurement and Using Useful Tools
Using Math Functions and Filters
Math function can be activated from the Function tool palette. To use a math
function, drag and drop a function icon on a waveform. The calculation result is
displayed on the Main Waveform. Double-clicking the icon can substitute for this
drag and drop operation.
The Function tool palette provides the following icons used for calculating and
filtering a waveform data.
Math
Add, Subtract, Multiply, Divide, Absolute, Average, Invert,
Magnify, Max, Min, Differentiate, Integrate, Square, and Square
Root
Filter
High Pass filter, Low Pass filter, and Smoothing
You can also use the Analysis dialog box (Analysis > Functions) to use the math
functions. The dialog box is opened by clicking the Analysis icon on the sidebar.
For example, drag and drop the 1 MHz Low Pass filter icon on the Channel 1
waveform when no Function is used. The Channel 1 waveform is filtered by the 1
MHz low pass filter and the Function 1 waveform is plotted on the same graph.
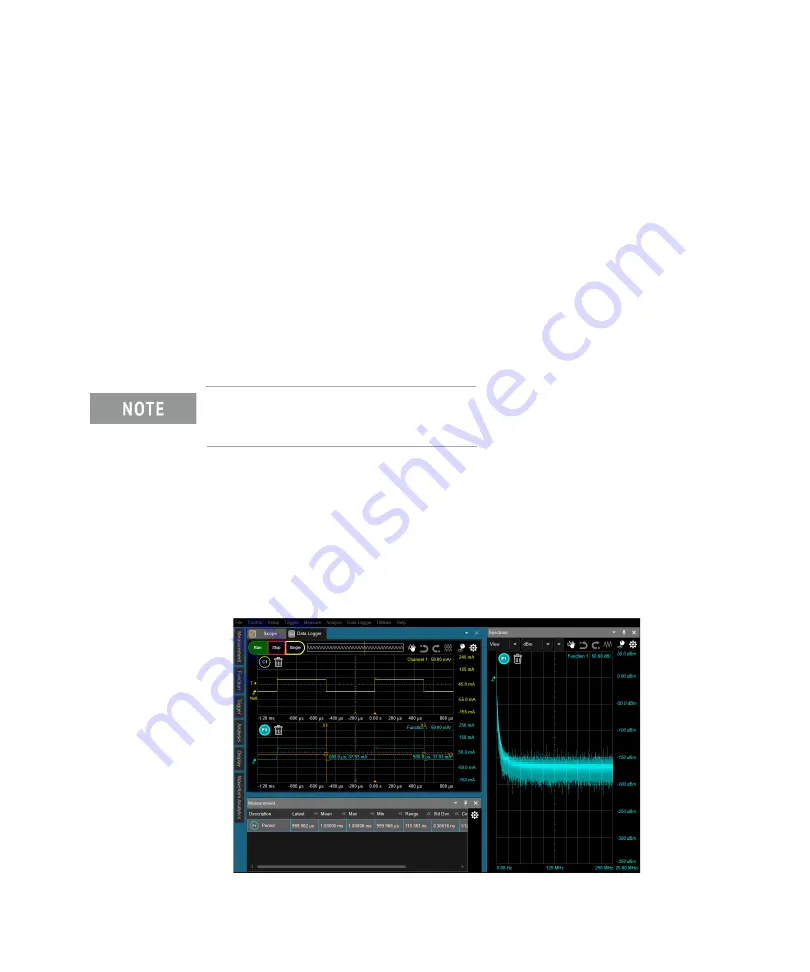
The following image shows an example of the CX3300 screen. The Main Waveform
displays two graphs. The top one shows the Channel 1 waveform and the bottom
shows the Function 1 waveform. The Measurement data view shows the
Frequency measurement result of the Function 1 waveform and the Spectrum
graph view shows the spectrum plot of the Function 1 waveform.
Channel 1 waveform
Function 1 waveform
Measurement data view
Spectrum graph view
Содержание CX3300 Series
Страница 8: ......
Страница 86: ...86 Keysight CX3300 User s Guide Edition 5 Using the CX3300 Using Online Help...
Страница 113: ......