


94
Swiping the graph left or right with two fingers is another way to move the graph forward or backwards in time. An
alternate way to change the time frame of the graph is to pinch or spread two fingers.
Settings
Touch any of the parameter tabs on the top of the graph to access graph settings.
Left Sensor
Enter this menu to select the sensor, analog input, flowmeter type digital input (total flow
and/or flow rate if applicable), or analog output value to show on the the left side of the
graph
Low Axis Limit
The graph auto-scales based on the sensor value if both Low and High Axis Limit are set to
0. To manually adjust the left Y axis scale, enter the low limit here.
High Axis Limit
The graph auto-scales based on the sensor value if both Low and High Axis Limit are set to
0. To manually adjust the left Y axis scale, enter the high limit here.
DI/Relay
Enter this menu to select digital input, or analog output value to show on the graph
Right Sensor
Enter this menu to select the sensor, analog input, flowmeter type digital input (total flow
and/or flow rate if applicable), or analog output value to show on the right side of the graph
Low Axis Limit
The graph auto-scales based on the sensor value if both Low and High Axis Limit are set to
0. To manually adjust the right Y axis scale, enter the low limit here.
High Axis Limit
The graph auto-scales based on the sensor value if both Low and High Axis Limit are set to
0. To manually adjust the right Y axis scale, enter the high limit here.
Time Range
Select the time range for the X axis of the graph.
The time range may also be accessed from the graph view by touching the time range icon in
the lower right corner.
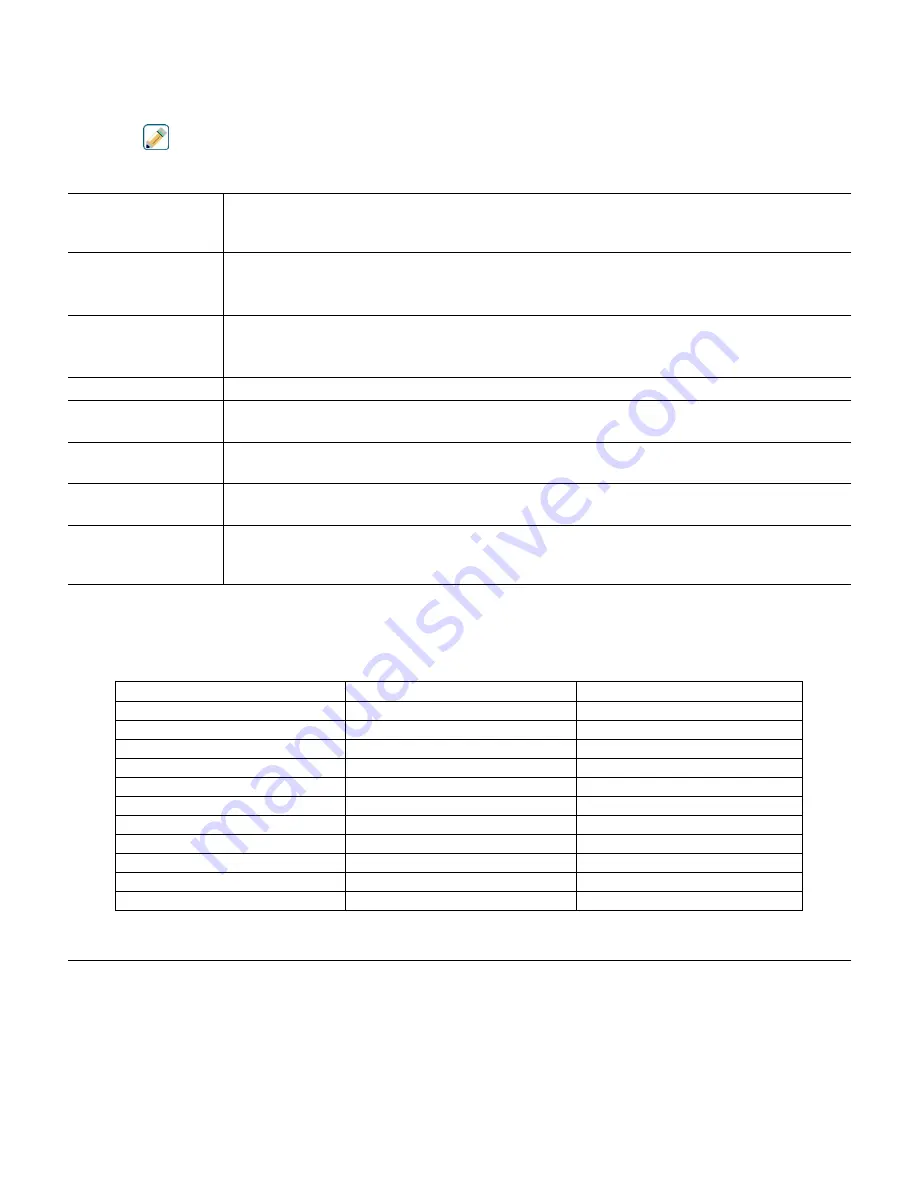
The resolution of the screen only allows for 180 data points per graph, so not all data points in each time range can be
shown. For finer resolution, download the data log CSV file from the Config – File Utilities menu and graph the data
in Excel or equivalent spreadsheet application.
Time Range
Time between data points
Datalog file used
10 minutes
10 seconds
Daily
30 minutes
30 seconds
Daily
1 hour
1 minute
Daily
2½ hours
2 minutes
Weekly
8 hours
6 minutes
Weekly
½ day
10 minutes
Weekly
1 day
20 minutes
Weekly
½ week
1 hour
Monthly
1 week
2 hours
Monthly
2 weeks
4 hours
Monthly
4 week
8 hours
Monthly
6.0 OPERATION using Ethernet
All of the same settings that are available using the touchscreen are also available using a browser that is connected to
the controller’s Ethernet IP address. The controller may be connected to a Local Area Network (LAN), directly to the
Ethernet port of a computer, or to the Fluent account management system server.
6.1 Connecting to a LAN
Connect the controller’s network card to the LAN using a CAT5 cable with RJ45 connector.


