


Chapter 2 - Features set
User Manual
R5000 series - Web GUI
27
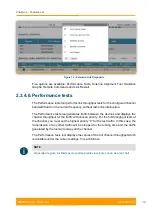
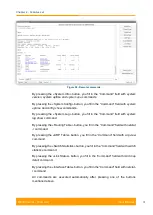
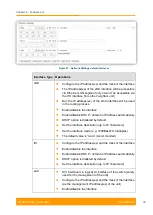
Figure 22 - Statistics graphs - balloon indicators
Working with the charts:
-
Select a chart region to zoom in
-
Hold the «Shift» button and drag the graphs to the pan
-
Double-click on any chart to reset the zoom
The parameters that can be monitored are:
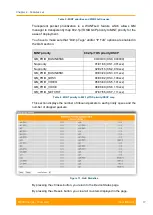
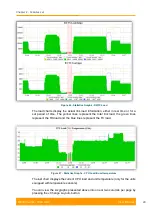
Figure 23 - Statistics Graphs - RX/TX Ref. Level
This chart displays the measured RX (green) and TX (blue) signal levels. Red
regions represent link outages. The default graph uses the CINR measurement
method; however, the RSSI method can be selected from the drop-down menu.
Содержание R5000 series
Страница 1: ...R5000 series Web GUI Software Version MINTv1 90 11 Last updated 8 31 2014 User Manual ...
Страница 10: ...Getting started Chapter 1 ...
Страница 13: ...Features set Chapter 2 ...
Страница 99: ...Configuration scenarios Chapter 3 ...


