background image

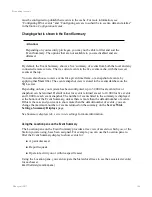
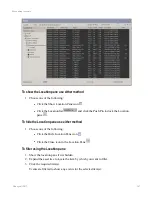
3. Select the sort order.

Tip:

The Event Summary can be sorted by a secondary column if this has been
enabled for your system. To perform a secondary sort, repeat the steps
above to sort the Event Summary on a second column. A pale sort icon will
be displayed over the primary sort column and a black icon will be
displayed over the secondary sort column. Note that if a third sort is
performed then the existing primary and secondary sorts will be removed
and the new selection will become the primary sorted column.

To remove sorting settings

1. Click

Clear All Filters

.

Tip:

If a custom filter has previously been applied, clicking

Clear All Filters

does not reset the summary back to the default view. Rather, all filters are
cleared and the view name is shown with an asterisk indicating it that the
view has been modified.

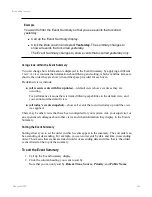
Example scenario - sorting the Events Summary

You want to sort the Events Summary so that events are listed in ascending order according
to point ID (0-9, A-Z).

Solution

1. Call up the Event Summary display.

2. Click the Source column.

3. Select

Sort Ascending

.

The Event Summary changes to list events in ascending order according to the point ID.

Resetting the Events Summary

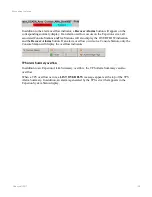
A

Reset View button is available on the toolbar of the Events Summary display. When

you click the Reset View button, the default summary display is loaded. For example, it will

Responding to events

Honeywell 2017

170

Содержание Experion LX

Страница 1: ...Experion LX Operator s Guide EXDOC XX80 en 500A April 2017 Release 500 ...

Страница 2: ...nal Sàrl While this information is presented in good faith and believed to be accurate Honeywell disclaims the implied warranties of merchantability and fitness for a purpose and makes no express warranties except as may be stated in its written agreement with and for its customer In no event is Honeywell liable to anyone for any direct special or consequential damages The information and specific...

Страница 3: ...nging your password 22 Logging off 22 Changing the security level in Station 22 Understanding security levels 23 Changing Station s setup file 23 Changing the Asset Profile of a Station or a Console 23 Changing the Console membership of a Station 25 About Station s layout 27 About multi window Station layout 29 The Station Status Bar 30 Station toolbar 32 About the Signon Manager Signon Bar 33 Ent...

Страница 4: ... pan and zoom displays 48 Panning a display 49 Zooming a display 51 Using displays in multi window mode 52 Responding to an error message box 52 System displays 53 Calling up a web page or file 53 Printing Station information 54 Understanding display objects 55 Abnormal alphanumeric value indication 56 Alarm state icons 57 Navigating between displays of referenced points 59 Using faceplates 60 Fac...

Страница 5: ...ewing related Equipment 89 Monitoring and controlling equipment 91 Using points 93 About points 93 About point parameters 93 About assets 93 About Alarm Groups 94 Controlling points 94 Controlling a point from a point detail display 94 Controlling a point from a custom display 95 Controlling a point from a faceplate 96 Controlling a point from a group display 96 Disabling or enabling a point or EF...

Страница 6: ...alarm 131 Silencing and acknowledging alarms 132 Shelving an alarm or alert 134 Considerations for configuring an alarm unshelving delay 135 Considerations for shelving TPS alarms 137 Responding to alarms on tabbed displays 138 Viewing suppressed alarms 139 How do I know if alarms are currently suppressed 139 How can I find out which alarms are suppressed and why 141 Checking the status of alarm s...

Страница 7: ...storing archived events 174 Restoring archived events from tape 174 Restoring archived events from FileSystem 175 Checking event records for tampering 175 Responding to messages 177 About messages 177 Calling up the Message Summary 177 Message Summary columns 178 Changing what is shown in the Message Summary 179 Using the Location pane on the Message Summary 179 Filtering and sorting the Message S...

Страница 8: ...93 Resetting the Alert Summary 193 Silencing and acknowledging alerts 194 Responding to an alert with Interactive Instructions 194 Alert Summary overflow 195 Exporting what is shown in a summary display 196 Displaying detailed process information 198 About Detail displays 198 About Point Detail displays 198 Calling up a Point Detail display 199 Displaying point history 200 Accumulator point 200 An...

Страница 9: ...EFM meter 243 About activities batches and procedures 245 Activity commands 245 Activity stages and states 246 Creating a batch or procedure 250 Batch or procedure creation and SOR 250 Calling up the activity batch or procedure summary 251 Summary display columns 254 Creating a batch or procedure from a summary display 255 Creating a batch or procedure from a custom display 256 Editing a batch or ...

Страница 10: ...ute button control 272 Mode attribute drop down control 272 Mode button control 273 Mode drop down control 273 Phase control 273 Procedure and sequence control icons 274 Procedure control 278 Procedure list control 278 Procedure panel control 278 Step and phase list control 279 Step control 279 Transition control 280 Transition list control 280 Unit control 281 Unit list control 281 Executing a ba...

Страница 11: ...erence 294 System status icons reference 295 Communicating with your colleagues 296 Producing reports 298 Requesting a report 298 Requesting a report from the Command Zone 299 Viewing a report 300 Standard report types 300 Printing a report of what is shown in a summary display 302 Reference topics 304 Menu summary 304 Station menu 304 Edit menu 304 View menu 305 Control menu 306 Action menu 306 H...

Страница 12: ...Faceplates with specialized behavior 319 Faceplates where auto selection is not available 328 Notices 330 Contents Honeywell 2017 12 ...

Страница 13: ...n page 104 Responding to events Responding to events on page 162 Responding to messages Responding to messages on page 177 Responding to alerts Responding to alerts on page 189 Monitoring system status What is the System Status display on page 290 Generating and printing reports Producing reports on page 298 Using the Message Pad Communicating with your colleagues on page 296 Loading recipes Loadi...

Страница 14: ...s including alarms and system events n Produces comprehensive reports The following figure shows a typical Experion system Experion runs on the server the main computer which collects and processes data administers system activities and performs automated tasks The controllers system interfaces and point servers are the hands and eyes of your system controlling and collecting data from your plant ...

Страница 15: ...ol panel that shows a particular set or type of information and has an appropriate set of controls such as buttons and scroll bars There are two basic types of display n System These are supplied with Experion and show information in a standardized manner For the most part system displays consist of lists and electronic forms containing system configuration details n Custom These have been created...

Страница 16: ...ay might include a schematic diagram of an air handling unit of an air conditioning system In addition to displays Station can display Web pages and files such as Microsoft Word documents which typically contain operating procedures A typical system display A typical custom display Understanding the basics Honeywell 2017 16 ...

Страница 17: ...ddition to a single instance of Station appearing in a single monitor multiple static Station allows you to have up to four instances of Station running simultaneously With this configuration you can position an instance of Station in a separate monitor What functions are available when the Experion server is unavailable If the Experion server becomes unavailable an alarm is raised on the Console ...

Страница 18: ...r equipment that is directly connected to the Console Station such as Process Controllers The status of other items is shown as unknown View and acknowledge system alarms on the System Status display Yes for equipment that is directly connected to the Console Station such as Process Controllers Other alarms are shown as questionable View faceplates in the Status pane on the System Status display Y...

Страница 19: ...Console membership Starting Station To start Station and log on 1 Start Station with whichever of the following options appear in your computer s Start menu a Server Station Experion server b Client Software Station Flex Station c Console Station Station Console Station Station establishes contact with the Experion server and displays the startup display specified in the default setup file 2 Your ...

Страница 20: ...tically reverts to the current user To log on as an override 1 Do one of the following l If the Signon Bar is visible click Signon Override l If the Signon Bar is not visible click the Signon Manager button on the Windows taskbar to make the Signon Manager visible and then click Signon l Press CTRL ALT S The Signon dialog box appears Attention If the card reader version of the Signon Manager butto...

Страница 21: ...and choose End Override l If you are using a card reader that has been configured to use the Sign off when card removed option you can remove the smart card from the reader Attention If you are not sure how the card reader has been set up for logging off check the Signon Bar after you have removed the card If you are logged on choose one of the other methods for logging off To logoff 1 Do one of t...

Страница 22: ... off Tip Station might be customized to log off automatically if you have not used the keyboard for a specified time To log off 1 In the Command Zone type bye and press ENTER Changing the security level in Station If you were not provided with a user name and password to log on to Station you are automatically assigned OPER security level when you start Station You can change to a higher security ...

Страница 23: ...ocedure if you want to use a setup file other than default stn To select another Station setup file 1 Choose StationConnect The Connect dialog box opens 2 Select the appropriate configuration file from the Recent Connections tab or the Other Connections tab The Recent Connections tab contains a list of setup files stn most recently used The Other Connections tab lists all your setup files If your ...

Страница 24: ... to which you have access and whose alarms you will be able to view and acknowledge on the Alarm Summary Attention l If your Station is a Flex Station you will have changed the SOR of only your Station l If your Station is a Console Station or a connected Console Extension Station which is not a member of a Console or is in a Console but has not been configured to use Console settings then you wil...

Страница 25: ...h the affected Stations have access and the alarms which will be able to be viewed and acknowledged on their respective Alarm Summaries Changing the Console membership of a Station Depending on a system s configuration it may be possible to change the scope of responsibility SOR of a Console Station by assigning it as a member of a different Console This functionality can be used to enable an oper...

Страница 26: ...lete the dialog The Console of which your Console Station is a member will change accordingly Attention This change in Console membership will change the SOR of your Console Station and any connected Console Extension Stations and may impact any operations currently being performed by an operator at any of the affected Stations If your Console Station is integrated with TPS you should now use the ...

Страница 27: ...hip will change the SOR of the selected Console Station and any connected Console Extension Stations and may impact any operations currently being performed by an operator at any of the affected Stations If the remote Console Station is integrated with TPS you should now use the TPS Native Window to change the TPS Area Number to which it is assigned The required TPS Area Number is defined on the C...

Страница 28: ...or tag name xxxx was not found appears in the message zone Messages and prompts that relate to a specific element on the display may be shown in callouts on the Station display instead of in the message zone For more information see About callouts Location pane The location pane is used for locating and filtering information For example if you are viewing the Alarm Summary it shows a hierarchical ...

Страница 29: ...re Station is configured for 100 zoom level scroll bars will appear in the display For this reason Zoom To Fit is generally recommended to avoid the need for scrolling Alarm line The alarm line indicates unacknowledged alarms Depending on how your system is configured the alarm line n Displays the most recent or oldest highest or lowest priority unac knowledged alarm n Includes only unacknowledged...

Страница 30: ... the status bar of your system may be different to those described in this topic For more information see Customizing alarm colors in the Station Configuration Guide The following table describes each box in the Status Bar starting from the left Status Bar for Flex Station Status Bar for Console Station Status Bar for Console Station Status Bar for an ES T Box Description Date and time The current...

Страница 31: ...here is at least one system alarm but they have all been acknowledged Click the box to call up the System Status display which lists each system alarm Message Indicates whether there are any messages as well as their status n Blank No messages n Flashing green There is at least one unacknowledged message n Green not flashing There is at least one message but they have all been acknowledged Click t...

Страница 32: ...lls up the Alarm Summary which provides a one line description of every alarm Acknowledge Silence Acknowledges the most recent or selected alarm alert or message Associated Display Calls up the display associated with the object that is in alarm or the selected object Callup Display Calls up the specified display To call up a display 1 Click the button 2 Type the display s name number and press EN...

Страница 33: ... Command Zone and press ENTER Raise Raises a parameter value Lower Lowers a parameter value Enter Accepts the newly entered value Cancel Cancels the newly entered value and returns it to its original value Enable Disable Enables disables for the associated point Points are typically disabled when performing maintenance tasks to prevent misleading alarms being generated Detail Search Performs eithe...

Страница 34: ...d off 3 Override User name This box is only visible when there is an override 4 Idle Timer This box is only visible if a user is signed on and an inactivity timer has been configured It shows the time remaining before the user will be automatically logged off Note that the idle timer is reset on every keyboard mouse and screen operation 5 Signon User name This box is only shown if a user is signed...

Страница 35: ...ter a command in the Command Zone 1 Give focus to the Command Zone l Press ESC l Press TAB until the focus moves to the Command Zone This method does not work in the multi window environment l If no data entry box has focus press an alphanumeric key l Press any of the function keys that require data entry l Click in the Command Zone 2 Type the command and press ENTER Tip The Command Zone retains a...

Страница 36: ...u change alphanumeric values For example n When you start editing a set point SP on a display or faceplate the current SP value is displayed in a callout beside the set point n When you change the SP of a point with control confirmation enabled the callout prompts you to confirm the change in value If the value that you entered exceeds the SP tolerance for that point the callout prompts you to con...

Страница 37: ...display to make the display area of the Station window larger or smaller To resize a display 1 Use the Zoom control on the toolbar to change the magnification of the display About alarms and other messages Experion has a control system that generates appropriate messages depending on how you are expected to respond at prescribed times or whenever there is a significant change in your system The wa...

Страница 38: ...the appropriate control or security level must acknowledge the message About Electronic Signatures on page 101 Alert An alert is generated to indicate an abnormal condition but the priority is not high enough for an alarm to be generated Responding to alerts on page 189 Attention Explanatory messages also appear in the Message Zone when for example you are issuing a command These messages are info...

Страница 39: ...s with the right button clicked The next time you touch the screen a right click is performed The touchscreen then returns to left click mode Using your keyboard You can perform all Station operations using your keyboard Searching for system items You can search for system items such as points operators and Stations using the Detail Search toolbar button or using the Command Zone and function keys...

Страница 40: ... Using Online Data Search Online Data Search enables you to search for tags with conditions on the parameter values residing in a controller and or devices This search can be started from the enterprise system level or from the server level When Online Data Online Data Search is launched from Station you can only execute queries Note that Online Data Search can be launched from Server Flex and Con...

Страница 41: ...ect the query and click Open You can also open the recently used five queries by clicking the query file name 3 Click Search The right pane displays the search results To execute a query from a custom display 1 Call up the custom display For more information see Calling up a display 2 In the custom display double click Search The Online Data Search page opens the selected query that was set in the...

Страница 42: ...e the one set of devices keyboard mouse and so on to control the multiple Stations in your Icon Series Console You give a Station or Station window focus by moving the position of the pointer from one Station to another using your mouse or trackball and clicking in the Station window As you physically move the mouse or trackball the pointer moves When you reach the edges of the monitor the pointer...

Страница 43: ...he name or number of a display you can call it up from the Command Zone For example to call up the numbered display 145 type pag 145 and press ENTER To call up a named display primary type primary and press ENTER Using tabbed displays If tabbed displays are enabled at your site you can call up displays in individual tabs within a Station window Each time you call up a display you can choose to ope...

Страница 44: ...r shows the name of the display contained in that tab If the name of the display does not fit on the tab it is truncated but you can see the full name of the display in a ToolTip if you hover over the tab header If there are any alarms on the display the tab also includes an alarm icon indicating the most important alarm in the alarm group associated with that display Attention Only the following ...

Страница 45: ...s To open a display in a new tab n Before opening a new display either l Click the button to show the outline of a new tab with the text Next Display or l Right click on any tab and choose Next Display in Tab Attention If the Next Display tab is visible but the next display you call up is already managed in a tab the existing tab will become selected The Next Display tab remains visible until you ...

Страница 46: ...ion s toolbar These buttons work in the same way as they do in Station when tabbed displays are not enabled except that Station display history takes into account which tab previously contained the display So for example going back or forward does not open the previous display in the tab that is currently open if the display was previously open in a different tab As with non tabbed displays you ca...

Страница 47: ... Only two tabs are open Boiler and Turbine 4 The operator clicks the navigate forward button to go to the Condenser display l The Condenser display is shown in the currently selected tab which was previously showing the Turbine display l The Turbine display is closed and no longer available in a tab Remember that the default setting is for new displays to be called up in the currently selected tab...

Страница 48: ...int detail display appears in the currently selected tab Boiler l The Boiler display is closed and no longer available in a tab l The navigate back button is still enabled and the history list contains the items Turbine Boiler and Condenser l The navigate forward button is enabled and the history list shows only System Trend l Two tabs are open Boiler_Valve point detail and System Trend Using pan ...

Страница 49: ...nal aid within the larger display The thumbnail also indicates active alarms from the entire display both inside and outside the current viewport as shown in this figure When viewing a pan and zoom display you can pan to different parts of the overview display and zoom in and out of the display Panning a display Each Pan and Zoom display has a thumbnail that provides a representation of the entire...

Страница 50: ...y dragging the viewport indicator in the thumbnail or by dragging the display itself This is referred to as Panning Panning enables you to move quickly to something that was previously not in view or only partially in view To pan within a pan and zoom display 1 Click the mouse button on any blank space within the display The cursor changes to a hand to indicate that the display can be moved 2 Whil...

Страница 51: ...nd within the display Zooming a display Pan and Zoom displays allow you to author a single large display covering all or a large portion of your process in a single display An example of a display that would benefit from this functionality is a map of a long pipeline with equipment at various locations The action of magnifying or shrinking areas within a display is referred to as Zooming You can z...

Страница 52: ...n behavior For example if your Station can have four displays visible at the same time when you call up a fifth display the oldest of the four displays is closed and the fifth display replaces the oldest display Regardless of how your site has been configured you use the same methods of calling up displays as those used for single mode Station Multi window Station and tabbed displays If tabbed dis...

Страница 53: ...atus of the meter You can acknowledge alarms on the EFM meter Group Displays various types of information about related points on a single display Status Displays detailed status information about system equipment such as controllers and printers Summary Displays information such as alarms and events in list form You can display more details about an item in the list by clicking it Trend Graphical...

Страница 54: ...mmand Zone 2 Type ftp ftp xyz com and press ENTER where ftp xyz com is the address of the FTP site Printing Station information At times you may want to print a snapshot of a display or whatever else is shown in Station In the case of a display the snapshot shows the display s values and status at the moment you issue the print command Tip Snapshots of summary displays can be printed at any securi...

Страница 55: ...ain types of display object If you are calling up a display from a Web browser instead of Station for example via Premium eServer you may be prompted to Click to activate and use this control for certain kinds of objects In this case you can either left click on the object with your mouse or you can tab to the object and then press the Spacebar or ENTER key Display object Description Alphanumeric ...

Страница 56: ...options You display the list by clicking the down arrow and then select the appropriate option by clicking it Abnormal alphanumeric value indication Depending upon the configuration of your Experion system you may at times see an alphanumeric display object change the display color of the point value or show other than a point value such as dots or an ellipsis question marks asterisks dashes or in...

Страница 57: ... takes into account factors such as the alarm priority alarm state and whether or not the alarm has been acknowledged Attention The alarm colors described below are the default alarm colors Your system may use custom alarm colors If the icon looks like this and it The alarm state is its priority is and its acknowledge status is Flashes Active Critical priority Not acknowledged Flashes Active Urgen...

Страница 58: ...ed for the point on this console only The point is disabled The point is Journal Only There are only shelved or suppressed alarms on the point There are only suppressed alarms on the point Invisible The point is not in alarm Alarm state icons and their meanings continued Alerts appear on selected points The following table describes how alert state icons change to reflect the alert state of the as...

Страница 59: ...ink n If the system detail display has the Chart tab configured the Chart tab of the detail display appears n If the system detail display does not have the Chart tab configured the main page of the detail display appears for the referenced point If the point refers to a custom detail display the custom display of the point appears For HART channels that are hyperlinked if the channel is reference...

Страница 60: ...click Start Live Updates Note that you will only see live updates if it has been configured as the default on the server and if JavaScript has been enabled on the browser n Click Modify if you want to change any parameter values and acknowledge an alarm The Modify option will only appear if you have permission to modify parameters for that point n Click More to view details of the point including ...

Страница 61: ...hand when you move the pointer over the object Depending on how your system has been set up you may be able to move faceplates to another position by clicking and dragging them There is a limit to the number of faceplates and popup windows that Station will keep open at one time For a single instance of Station appearing in a single monitor if you have opened the maximum number of faceplates and y...

Страница 62: ... about faceplate items such as alarm status indicators and parameter values A ToolTip appears if you position the mouse pointer over the item Typical ToolTips Shortcut keys and shortcut menus Shortcut keys and shortcut menus help speed up point control Using faceplates Honeywell 2017 62 ...

Страница 63: ... set up for auto selection it automatically selects the appropriate element for point control when you call up a supported faceplate and when the point s MODE is set to AUTO or MAN For example if the point MODE is AUTO and the point s faceplate supports auto selection the system automatically selects the SP element You can type or ramp to a new set point without having to first click the SP elemen...

Страница 64: ...independent commands You can always perform the following commands on the faceplate s current point as long as the faceplate has focus Command OEP IKB keyboard PC keyboard Select SP SP key Alt 11 Select OP OUT key Alt 12 Change mode to Manual MAN key Alt F5 Change mode to Auto AUTO key Alt F6 Change mode to Normal NORM key Alt F7 Acknowledge alarm ACK key F4 Silence SIL key Point Detail DETAIL key...

Страница 65: ... figure shows how a typical faceplate is divided into four major zones n Description Zone Shows the point ID description and status n Indicator Zone Shows PV set point and related information n Alarm Zone Shows the most recent highest priority unacknowledged alarm n Control Zone Contains the buttons and boxes you use to control the point The basic layout of a faceplate Description Zone Indicator Z...

Страница 66: ...o the three basic point types status analog and accumulator the differences between Indicator Zones for a particular point type are relatively small For example the Indicator Zone for one status point may only include two LEDs because the point only supports two states such as off and on whereas the Indicator Zone of another status point may include eight LEDs because the point supports eight stat...

Страница 67: ...Alarm Summary You can acknowledge all alarms on the point by clicking the Acknowledge Silence Alarm button on the right For systems configured with IKB or OEP keyboards you can acknowledge all alarms on a point by pressing the ACK key when the faceplate has the focus Control Zone The Control Zone includes the buttons and boxes you use to control the point The controls are appropriate to the specif...

Страница 68: ...es you will see depends on the types of equipment used in your system The following faceplates are typical examples your faceplates may vary in appearance depending on the type and status of the points that you view Example Process point faceplates Status point Analog point Accumulator point Using faceplates Honeywell 2017 68 ...

Страница 69: ...buttons that are commonly used on faceplates Meter faceplates If your system uses Electronic Flow Measurement EFM some faceplates will represent EFM meters showing a description and the status of the meter You can acknowledge alarms on the EFM meter See the topics titled Faceplate Indicator Zone symbols and EFM meter faceplates for more information Using faceplates Honeywell 2017 69 ...

Страница 70: ... bar the point is under direct control n When the position of the symbols are reversed that is the outline symbol appears at the top of the OP indicator bar and the solid symbol appears at the bottom of the OP indicator bar the point is under reverse control Tip Position the mouse pointer over the OP indicator bar to display a ToolTip which indicates if the point is under direct or reverse control...

Страница 71: ...after the close command is issued and feedback is received Red Damper is open after the open command is issued and feedback is received Yellow Damper is bad CM CEE Inactive receiving both open and closed feedbacks Gray Valve is inactive Green Valve is closed after the close command is issued and feedback is received Red Valve is open after the open command is issued and feedback is received Yellow...

Страница 72: ...er of collection retries has not yet been reached The export is in progress Failed The last scheduled collection and all retries for it have failed The last export attempt failed Indicator Zone symbols for EFM meters Faceplate Control Zone symbols The following table describes common Control Zone symbols If you see a symbol that is not described here ask your supervisor or an experienced colleague...

Страница 73: ...llowable range OP The mode of the point is changing from its current mode to a CASCADE mode PV The FFB box has failed PV The PV is in high priority alarm PV The FFB box is in an idle state AMC only OP The OP is no longer controlling the SP of the downstream controller rather the reverse is occurring This has occurred because the mode of the downstream controller has been changed from CASCADE to AU...

Страница 74: ...lization manual OP Safety Interlock OP cannot be commanded to different state OP Override Interlock OP cannot be commanded to different state OP Permissive Interlock OP cannot be commanded to different state Various Black no state bad state Red off failure state Yellow warning intermediate state Green on OK state Off normal indication When the Mode MD or the Mode attribute MD Attr parameter value ...

Страница 75: ...d question marks dashes or asterisks If red question marks appear in the PV box it means either n the server cannot determine the value perhaps because the server has lost contact with the field device or n the value cannot be displayed perhaps because the value contains more characters than the display field can accommodate Red dashes indicate that the server cannot find the parameter Red asteris...

Страница 76: ... supervisor or an experienced colleague for help Button Description Faceplate related Pushpin If pressed the faceplate remains visible even if you call up other displays or call up more faceplates Close Closes the faceplate Point related Acknowledge Silence Alarm Acknowledges silences the alarm on the point This button is functionally equivalent to the Acknowledge Silence Alarm button on Station s...

Страница 77: ...Button Description toolbar Using faceplates Honeywell 2017 77 ...

Страница 78: ...tation only Equipment for which you have scope of responsibility is visible to you If the Operator security level on your Station changes to a lower security level such as during Operator changeover Equipment displays will return to a default view of the page showing assets for only the lower Operator security level New display layouts have been developed for Equipment providing a rich collection ...

Страница 79: ... been configured for an Equipment Detail display you can use icons in the display header to switch between them Images used in this guide to represent Equipment displays should therefore be viewed as examples only The displays at your site may be quite different depending on how they have been configured Here is an example of a possible layout for the Equipment Summary the card view Equipment summ...

Страница 80: ...to three key parameters which can be presented numerically and or graphically in a mini trend as shown Summary display elements continued Here is an example of a possible layout for the Equipment Detail the card view Example of an Equipment Detail display 1 2 3 Item Description 1 Equipment Detail header containing n Navigation options enabling you to move to other equipment items from the filtered...

Страница 81: ...r graphically by mini trends or indicators showing a value and an SP as shown in the above example 3 Equipment data For the table view as shown above each expandable group contains parameters and values Depending on how the equipment has been configured values could be presented numerically or by an indicator showing a value and an SP Summary display elements continued Viewing the Equipment Summar...

Страница 82: ...oup When clicked the header expands or collapses the section within The numbers after Equipment type headings Tests Fields indicate the number of equipment listed in that section 3 Equipment data For the card view as shown each card contains n Alarm indication if required n Name of equipment n Description n Units of measurement optional n Up to three key parameters which can be presented numerical...

Страница 83: ...expands or collapses the section within The numbers after Equipment type headings Tests Fields Wells indicate the number of equipment listed in that section 3 Equipment data For the table view each table contains n Alarm indication if required n Name of equipment click on the name to go to the detail display for that equipment n Columns containing values for each of the configured key parameters w...

Страница 84: ... you want to update and replace the existing value with a new value As soon as you position the cursor into an edit box to change a parameter value the system automatically pauses any live sorting that is occurring for the group The parameter values for the group will continue to update only the reordering required to meet the sort criteria will pause Tip Click on an Equipment name to navigate to ...

Страница 85: ...asset The text in the header changes to show that this filter has been applied In this example the only equipment contained within the asset GWPOD003 is of the type Wells For this reason the All Equipment text has changed to Wells Viewing equipment Honeywell 2017 85 ...

Страница 86: ...onfiguration there could be several levels of filter to choose from In this image you could select to filter the view to only wells with dif ferent characteristics that are Underperforming or In Alarm for example Equipment menu 2 Click an equipment filter to show only equipment meeting that criteria The text in the header changes to show that this filter has been applied Viewing equipment Honeywel...

Страница 87: ...nt to view for example GWPODWELLM003 The Equipment Detail display for that equipment appears Equipment Detail display 1 2 3 Item Description 1 Equipment Detail header containing l Navigation options enabling you to move to other equipment items from the filtered list on the summary l View icon table trend or schematic view click to move between data views l A list of links for other content relate...

Страница 88: ...ns parameters and values Depending on how the equipment has been configured values could be presented numerically or as a dual indicator showing a value and an SP Equipment Detail display elements table view continued Depending on how Equipment Detail displays have been configured for your site the data can be presented in any of these different views l Table as shown above l Schematic l Trend To ...

Страница 89: ...well as links to related displays or information about this equipment The Equipment Detail display changes to the view you have selected If you selected a display from the Related Links list the system navigates to the specified display for that equipment This could include displays such as the Alarm Summary Viewing related Equipment If related equipment has been defined and configured for this eq...

Страница 90: ...pment item you can use the navigation options provided in the header to move to detail displays for related equipment that was listed before and after the current item in the Related Equipment table l Alarm aggregation from the related equipment items to this equipment item l Key parameter values for the equipment enabling you to monitor all the related equipment from the one display Viewing equip...

Страница 91: ... automatic data sorting at any time but it will automatically pause if you edit a parameter To edit values in the equipment table 1 From any Equipment Detail display click the Tabular View icon in the header to dis play the data in a tabular view Equipment Detail display Table View 2 All parameters that can be edited show a border around the value when hovered over with the mouse Click in the edit...

Страница 92: ... to the next field to be edited to commit the change to the con troller 4 Click Resume live update at the bottom right of the display to resume sorting if applic able Monitoring and controlling equipment Honeywell 2017 92 ...

Страница 93: ...or is On you can change the real state of the motor to Off using the display About point parameters Each item of information about a point is called a parameter The main parameters store n The current value or state of the point sometimes referred to as Process Variable or PV n The desired value or state of the point sometimes referred to as Set Point or SP n The output value of the point sometime...

Страница 94: ...ve view of the points and their alarms in the Alarm Summary Alarm Groups have a Detail display which provides alarm accounts for the points within the Alarm Group Controlling points You control your system by controlling points For example to turn off a motor you would set the appropriate parameter of the associated point to Off Attention The amount of control you have depends on several factors i...

Страница 95: ... boiler temperature is called boiler1_temp The point has the following parameters n PV which shows the current temperature n SP which you use to change the desired temperature You are currently viewing a display which graphically shows the boiler as well as labeled alphanumeric display objects for the parameters Solution 1 Select the alphanumeric that shows the SP The object is editable if the val...

Страница 96: ...rom a faceplate A group display is really just a collection of faceplates for related points One difference however is that the faceplate of the point you want to control may not be selected when you call up the group display Therefore you may first have to select the appropriate faceplate before you can control the point Disabling or enabling a point or EFM meter You typically need to disable a p...

Страница 97: ...ecuting schedules are abandoned To enable a disabled EFM meter 1 Display the meter in the meter detail display 2 Select the Enable check box When you enable a disabled meter l Data collection will begin at either the next scheduled interval or when a manual collection is requested l Because of the potentially large load this may have on channels and controllers there will be some throttling of EFM...

Страница 98: ... an operator tag the red tag symbol takes precedence Prerequisites The point must assigned to your scope of responsibility SOR The MODE of the point must be set to MANUAL To add a red tag you must have ENGR security access To add a red tag to a point 1 Double click the object on the display that is associated with the point to call up the point detail display for the point 2 On the Main tab select...

Страница 99: ...e current normally operating value of the set point to serve as a reminder for the purposes of resetting the Current SP at completion of the maintenance operation Attention The use of Preferred SP is determined by the Server wide Station Settings Faceplates Options To view the Preferred SP value if set of a point 1 Click the object on the display that is associated with the point to call up the fa...

Страница 100: ...left side edge of the PV bar graph in the faceplate Indicator Zone l The SP box in the faceplate Control Zone 3 Choose Save as preferred SP The Preferred SP value is set to the current SP value The current SP is not affected Tip The current SP indicator solid green arrow will overlap and conceal the Preferred SP indicator hollow green arrow in the SP Indicator Zone area to the immediate left side ...

Страница 101: ...immediate left side edge of the PV bar graph in the faceplate Indicator Zone and choose Clear preferred SP from the shortcut menu About Electronic Signatures As a security measure certain types of messages and control point changes may require confirmation with either one or two electronic signatures When an electronic signature is required an Electronic Signature dialog box appears You may in som...

Страница 102: ...tor who has a control level that is equal to or higher than the point s control level can control that point When you attempt to make a change to a point the minimum control or security level required is shown in the Electronic Signature dialog box If a secondary signer is also required the dialog box will contain two tabs one for each of the signers The required security level of the second signe...

Страница 103: ...equired 5 Type any additional information under Comments 6 Click Sign Your signature is locked in and cannot be changed 7 Click the Secondary signature tab The secondary signer must have a different user name from the primary signer and must have a security level equal to or higher than level displayed in the Secondary signature tab 8 The secondary signer types their user name domain and password ...

Страница 104: ... For more information see Producing reports Tip n The Alarm box in the Status Bar flashes red if there are any unacknowledged alarms n The System box in the Status Bar flashes cyan if there are any unacknowledged system alarms n If configured for your system you can display help information associated with each process alarm Calling up the Alarm Summary Alarms are listed on the Alarm Summary which...

Страница 105: ...en Typical Summary of Alarm Status In the case of Shelved alarms the value will always be of the form 0 of xx unless you have selected the shelved alarms view In the case of Suppressed alarms the value will always be of the form 0 of xx unless you have selected the suppressed alarms view 1 To display the Details pane click Show details pane on the Alarm Summary tool bar 2 To see a graphical view o...

Страница 106: ...g Bad quality state Disabled state Alarm state Magenta and flashing the alarm is critical priority unacknowledged and the cause of the alarm still exists Magenta and not flashing the alarm is critical priority acknowledged and the cause of the alarm still exists Inverse color and flashing the alarm is critical priority unacknowledged and the cause that generated the alarm no longer exists Red and ...

Страница 107: ...ed and the cause of the alarm still exists Yellow and not flashing the alarm is high priority acknowledged and the cause of the alarm still exists Inverse color and flashing the alarm is high priority unacknowledged and the cause that generated the alarm no longer exists Cyan and flashing the alarm is low priority unacknowledged and the cause of the alarm still exists Cyan and not flashing the ala...

Страница 108: ...alert Inverse color indicates that the alert has returned to normal Suppressed critical alarm Suppressed urgent alarm Suppressed high alarm Suppressed low alarm Date Time The time and date when the alarm was received This alarm was previously suppressed but is now unsuppressed and the date and time value shown here is when the alarm was unsuppressed not when the alarm was first received To find ou...

Страница 109: ...Critical n Urgent n High n Low If a number follows the letter it represents the relative priority within the general priority For example Urgent alarms can vary from U15 most urgent to U00 least urgent Description A description of the alarm If the description is too long to be fully displayed in the alarm summary it is truncated To see the full description place the mouse pointer over the partial ...

Страница 110: ...CM or CR failed The following table illustrates the format of the text in the Description column based on the failure point Failed point Text format in the Description column Step output Step description Output description Transition condition Transition description Condition description Phase block Phase block description Text format in the Alarm Summary Description column For the Fail Alarm to d...

Страница 111: ...journal when an alarm is generated during a failed step output this event is not updated when the failed step output is skipped using the Force Request option For example consider a scenario where there are multiple outputs in a Step block and more than one outputs are in a failed state In this scenario the Description column displays the step output description of the first failure However if you...

Страница 112: ...e highest thread number to left the lowest thread number in the Control Builder chart view Occasionally the thread number is not lined up with the pin order in the Sync block For example when a new thread is added by adding a new pin to the left instead of the right or moving a pin around In such scenarios the execution order is not always from the right most pin to the left Changing what is shown...

Страница 113: ...he Station you are using have been assigned The Location pane on the System Status display provides tree views of your network components and system components You can use the Location pane to filter the Alarm Summary and the System Status display to show alarms for n A particular asset n An Alarm Group n A particular piece of equipment Using the Location pane you can easily see the highest priori...

Страница 114: ... dock the Location pane To hide the Location pane 1 Choose one of the following l Click the Hide Location Pane icon l Click the Close icon in the Location Pane To filter using the Location pane 1 Show the location pane if it is hidden 2 Expand the asset tree to locate the item by which you want to filter Responding to alarms Honeywell 2017 114 ...

Страница 115: ...ationships and criticality to be represented You can use the Dashboard pane to filter the System Status display to show alarms for n A particular piece of system equipment n A particular network component n A lower level dashboard system alarm group Using the Dashboard pane you can easily see the highest priority alarms and where they are occurring in the context of your plant You can also see the...

Страница 116: ... To filter the results pane using the Dashboard pane 1 Show the Dashboard pane if it is hidden 2 Click the required item on the dashboard to filter the results pane by that item The items shown on a dashboard can be a network component system equipment or sys tem alarm groups Alarms are filtered to show any alarms for the selected item Using column filtering and sorting on the Alarm Summary On the...

Страница 117: ...xample to filter the Alarm Summary according to l When the alarm occurred click the Date Time column l Whether the alarm has been acknowledged or not click the alarm icon column at the very left of the Alarm Summary l Alarm priority click the Priority column A drop down list of filter options is displayed 2 Click the filter that you want to apply When you click a filter l The column heading that y...

Страница 118: ...he Alarm Summary To remove column filtering 1 To remove individual filters click the appropriate column heading to show which filter is or which filters are currently applied in that column and then click the filter you want to remove Clicking a selected filter removes the tick beside that filter option to show that the filter is no longer applied and changes the Alarm Summary display accordingly ...

Страница 119: ...lumn Tip Note that the Priority column shows the priority in the format H U or L and shows the sub priority in the form of a number from 00 to 15 where 00 is the lowest and 15 the highest sub priority Example scenario Filtering You want to filter the Alarm Summary so that you see unacknowledged alarms of urgent and high priority only Solution 1 Call up the Alarm Summary display 2 Click the Priorit...

Страница 120: ...l alarms shows all alarms n recently unshelved alarms shows only those alarms that were recently unshelved n shelved alarms shows only shelved alarms n suppressed alarms shows only suppressed alarms n unacknowledged alarms shows only unacknowledged alarms n urgent and high priority alarms shows only alarms of urgent and high priority n urgent priority alarms shows only alarms of urgent priority Th...

Страница 121: ...so displayed beside the name of the view if you change the column configuration of the Alarm Summary for example when you add or remove columns If a custom filter has previously been applied clicking Clear All Filters does not reset the summary back to the default view Rather all filters are cleared and the view name is shown with an asterisk indicating it that the view has been modified Using the...

Страница 122: ...f alarms on the Alarm Summary You can n Use your mouse and click on the scroll bar n Use your mouse wheel if your mouse has one n Use the Up and Down arrow keys on your keyboard n Press the PAGE UP and PAGE DOWN keys to scroll a page at a time n Press the HOME key to go to the first alarm in the summary n Press the END key to go to the last alarm in the summary If you want to use your keyboard key...

Страница 123: ...alarms view It will also reset all filters and column positions back to default settings To reset the Alarm Summary 1 On the Alarm Summary toolbar click Reset View 2 Acknowledge the Yes No warning message displayed at the top of the summary dis play Opening and using an alarm tracker Alarm trackers are available in a pane that you can open in the Alarm Summary Like the Location pane on the Alarm S...

Страница 124: ...privileges n The left part of the axis represents the older or historical time area The period covered in this area can be adjusted by moving the slider bar at the bottom of the asset list to the left or right to increase or decrease the time period An Alarm Tracker pane in the Alarm summary Prerequisites n Your site has a license for the Alarm Tracker option n You have called up the Alarm Summary...

Страница 125: ...y only be one alarm track in the Alarm Tracker pane Attention Note that the alarm tracker will show no more than 1000 alarm icons If there are more than 1 000 alarm icons to be displayed in the time period shown in the Alarm Tracker pane the alarm tracker will be partially shaded to indicate that the maximum number of alarm icons that can be displayed has been reached This shaded area will hide ol...

Страница 126: ...alarms occur at exactly the same time In this case only the label for the topmost alarm icon is shown The topmost alarm icon is always the one representing most important alarm state For more information see the topic How the most important alarm state is determined To identify alarm clusters and filter the alarm table for alarm clusters 1 Click an alarm icon in an alarm track This selects the ala...

Страница 127: ...ck The alarm table now shows an unfiltered view of all alarms To respond to alarm clusters or individual alarms in an alarm track 1 Right click an alarm icon to select the alarm cluster to which it belongs 2 To acknowledge the whole cluster right click the cluster and choose Acknowledge Cluster on the shortcut menu Attention Responding to alarms Honeywell 2017 127 ...

Страница 128: ... tracker l Total alarms The total number of alarms in the asset or alarm group that may or may not be currently shown in the Alarm Tracker pane A button in the column immediately to the right of the asset or alarm group name indicates that there is at least one alarm in that alarm track that is not visible in the current time frame l Hover over the button to display a ToolTip that shows the number...

Страница 129: ... in the selected cluster 2 In the alarm table right click the alarm whose details you want to view and choose Detail Display or Associated Display on the shortcut menu Tip You can use the same procedure to call up the Suppression Status display To change the height of the Alarm Tracker pane and the alarm tracks 1 Click the line dividing the Alarm Tracker pane from the alarm table pane The mouse po...

Страница 130: ...tion see Assigning an alarm tracker to operators Stations Consoles and Console Stations How the most important alarm state is determined The most important alarm state on a display or in an alarm group associated with a custom display is determined according to the following order of precedence which takes into account the alarm priority alarm state and whether or not the alarm has been acknowledg...

Страница 131: ... the Alarm Help from different points within the interface as detailed below From the do this Display Right click the alarm for which you want help The shortcut menu appears a Click Alarm Help Information about the alarm appears on the Alarm Help tab such as the point name trip value and time to respond b Click More Details to navigate to the ACM Web page for the selected point Details Pane a Sele...

Страница 132: ...mpact 3 Click More Details to navigate to the ACM Web page for the selected point Silencing and acknowledging alarms In most systems Station produces an alarm tone when a new alarm occurs Your system may be configured not to do this There are several ways of silencing or acknowledging alarms To Do this Silence the tone Either n Click the Acknowledge Silence toolbar button n Click the Silence butto...

Страница 133: ...ntion Page acknowledgement may take one to two minutes to complete in situations where the Alarm Summary consists mainly of alarms for points on SCADA devices with a particular configuration Acknowledge a cluster of alarms on an alarm tracker If your site is licensed for Alarm Tracker and you have opened the Alarm Tracker pane on the Alarm Summary you can acknowledge an alarm cluster that is a gro...

Страница 134: ...g valid timestamps so shelving alarms or alerts with an Unknown timestamp is not supported A shelved alarm or alert is automatically unshelved at the end of the shelving period which depends on a number of factors such as the reason it was shelved Alternatively you can manually unshelve it before the shelving period has expired To shelve an alarm or alert for the default time and reason 1 Call up ...

Страница 135: ...m or alert will be unshelved once it returns to normal This helps to prevent nuisance alarms or alerts cluttering the display See the topic titled Considerations for configuring an alarm unshelving delay for more information 6 If appropriate for the alarm or alert in the Comments box type your detailed reason for shelving the alarm or alert 7 Click OK To unshelve an alarm or alert 1 Call up the Al...

Страница 136: ...e figure shows the profile of a point in alarm The operator shelves the alarm on the first instance but almost immediately it returns to normal and is unshelved Five seconds later the point returns to alarm and reappears on the Alarm Summary The operator would need to shelve the alarm again Alarm unshelving delay is disabled Example 2 Alarm unshelving delay is set for 10 seconds In this example th...

Страница 137: ...s unknown when the EST is restarted In this case if the alarm is unshelved on the EST where the alarm now has unknown timestamp the alarm will remain shelved on the other EST s and the Experion server Generally alarms will have unknown timestamps if an alarm recovery on the LCN has occurred but the alarms were not in the Native Window alarm summary list prior to the recovery Similarly you may want...

Страница 138: ...a US GUS node If the annunciator is connected to a US GUS node the use of alarm shelving with TPN points is not supported Responding to alarms on tabbed displays If tabbed displays are enabled in your system the tab shows an alarm icon representing the alarm status These are as follows n When an alarm group is associated with a display and it is in alarm the tab icon represents the most important ...

Страница 139: ... be automatically and temporarily removed from the default that is unfiltered view of the Alarm Summary when certain alarm conditions are met The aim of DAS is to minimize the impact of alarm bursts or floods related to consequential alarms For example if a pump goes offline alarm suppression may have been configured for your system to suppress downstream alarms such as low flow alarms and other a...

Страница 140: ...ount is shown as 0 of 2 this means that there are no suppressed alarms in the current view but 2 alarms are currently suppressed Tip If alarm groups have been configured for your system alarm groups are configured via Configuration Studio you can also see suppressed alarm counts on an alarm group detail display 2 If you are currently viewing a faceplate the ToolTip on the alarm icon indicates that...

Страница 141: ...ed that is removed from the default unfiltered view of the Alarm Summary and why To find out which alarms are suppressed and why they are suppressed 1 Go to the Alarm Summary and do one of the following l Click the box at the top of the alarm icon column and from the list of column filters choose Suppressed The Alarm Summary now shows only suppressed alarms l From the View list choose suppressed a...

Страница 142: ...u have applied the suppressed alarms view you can change back to showing all alarms by choosing the all alarms View 2 If the Alarm Details pane is not already open click the Details pane icon on the Alarm Summary toolbar The General tab of Alarm Details pane provides high level information about the suppression status of the currently selected alarm see the Flags and Suppressed entries 3 Click the...

Страница 143: ...k whether a suppression group is currently suppressing or not suppressing alarms You can also view the current configuration settings for a suppression group Prerequisites n You have logged on as a member of one of the following Windows groups on the Experion server to which your Station is connected Local Ack View Only Users Local View Only Users Local Operators Local Engineers Local Supervisors ...

Страница 144: ...ConfigureAlarm Event ManagementAlarms to call up the Alarm Configuration displays and then click the Alarm Suppression tab The Suppression Status display appears listing all suppression groups loaded to this cluster Tip If the State of a suppression group is shown as Disabled disabled from Station Suppressing enabled from Station or Not suppressing enabled from Station this means there is currentl...

Страница 145: ...ilters button in the top right of the dis play Tip If a custom filter has previously been applied clicking Clear All Filters does not reset the summary back to the default view Rather all filters are cleared and the view name is shown with an asterisk indicating it that the view has been modified 3 Use the tabs at the bottom of the list of suppression groups to see l Which if any alarms in the cur...

Страница 146: ...r an explanation of the property settings see the Station Configuration Guide Properties tab 4 To filter the list for specific alarm suppression groups click the Suppression Group column This displays a drop down box in which you can enter filter values to display l Suppression groups that include specific points or l Specific suppression groups When filtering you can use the same wildcard charact...

Страница 147: ... Enabling and disabling alarm suppression groups Users with supervisor or higher privileges can use the Suppression Status display to override the current enabled disabled setting of a suppression group For example an alarm suppression group may be currently configured to hide a specific group of related alarms from the default unfiltered view of the Alarm Summary However there may be circumstance...

Страница 148: ...suppression group content n You have logged on to Station using an account with supervisor engineer or manager privileges If you log on using an account that has operator privileges you can view configuration details but you cannot change the enabled disabled setting of a suppression group n You have called up the Suppression Status display as described in the topic Checking the status of alarm su...

Страница 149: ...Station n This change or override applies only to the server cluster that you are currently connected to It does not change the setting on server clusters elsewhere in the system Furthermore when you override the enabled disabled setting that was configured for the suppression group the override is removed the next time that suppression group configuration data is loaded to the server you are curr...

Страница 150: ...up has been enabled or disabled and if so by whom and when n When a group was last loaded and by whom This historical information is useful for post incident analysis or troubleshooting especially for alarms in suppression groups that are no longer active and therefore no longer available in the suppressed alarms view of the Alarm Summary As with any other type of alarm related event you can acces...

Страница 151: ...ssion event a Open the Event Details pane if it is not already shown at the bottom of the Event Summary To open the Event Details pane click the details pane icon in the top right of the Event Summary b Click the event for which you want more details The Details pane shows information on the selected event An example of an Event Details pane for a suppression event Suppressing audible annunciation...

Страница 152: ...is includes urgent alarms l The button changes to which indicates that audible annunciations are suppressed for both high and low alarms l Click the button a second time and the state changes to which indicates that audible annunciations are suppressed for low alarms only l Click the button a third time and the state returns to That is audible annunciation suppression is turned off You can tell th...

Страница 153: ...pression period will continue to remain suppressed Re annunciated alarms will also continue to remain suppressed Only new alarms will sound About suppressing audible annunciations Overview Experion servers Console Stations and Flex Stations can be configured to suppress certain audible annunciations such as low priority alarms This can be useful in situations where multiple alarms related to the s...

Страница 154: ...aximum suppressible priorities Note that all existing alarms including urgent alarms are silenced when the Suppress audible annunciations button is clicked However audible annunciation of urgent alarms that occur after the initial silencing is not suppressed Urgent alarms include urgent system alarms and urgent process alarms Suppression button behavior The Suppress audible annunciations button th...

Страница 155: ...ing urgent alarms However any new urgent alarms that occur will be annunciated n Suppression of the audible annunciation will last for the duration predefined for your system n Ten seconds prior to the suppression period ending the suppression buttons begin to flash to alert you that the suppression period is about to end n At any time during the suppression period you can click the suppression bu...

Страница 156: ...u have the security level or higher required to enable or disable alarms for assets within a console For more information see Configuring the minimum security level required to enable or disable alarms for assets within a console To disable alarms within a console for an asset 1 On Station choose ConfigureSystem HardwareConsoles The Consoles configuration display appears 2 Click the console where ...

Страница 157: ...e click the video clip icon associated with the alarm listed in the summary The video clip associated with the alarm will be displayed in a popup window Alarm list overflow The alarm list which contains alarms alerts that are shown in the Alarm System and Alert summaries has a limit of 14999 alarms When this limit is reached an event is logged in the Event Summary When this limit of 14999 alarms h...

Страница 158: ...larms button If an alarm overflow occurs on a Console Station only the Console Station will display the overflow indicators TPS Alarm Summary overflow In addition to an Experion Alarm Summary overflow the TPS Alarm Summary can also overflow When a TPS overflow occurs a LIST OVERFLW message appears at the top of the TPS Alarm Summary In addition an alarm is generated by the TPS server that appears ...

Страница 159: ...utton will cause a confirmation message to appear in the message zone of the Station screen If the operation is confirmed the Experion server attempts to recover any C300 SCADA or DSA alarms it discarded during overflow Some notifications are not recoverable such as ones that have returned to normal or most local system alarms Responding to alarms Honeywell 2017 159 ...

Страница 160: ...on Controller FTE n If an alarm overflow occurs on a cluster server clicking the Recover Alarms button will cause alarm recovery on the server n If an alarm overflow occurs on a Console Station clicking the Recover Alarms button will cause alarm recovery on the Console Station n If an alarm overflow occurs on both the cluster server and a Console Station clicking the Recover Alarms button on the C...

Страница 161: ...Attention DSA and SCADA alarms can only be recovered if the Experion server is performing an alarm recovery Responding to alarms Honeywell 2017 161 ...

Страница 162: ...see the list of events Depending on how your system is configured the list of events includes live events from all servers publishing to the live event cache or from the local server only Tip You can also call up the Event Summary by clicking Events on the System Menu Events are listed in chronological order starting with the most recent event The display is automatically updated which means that ...

Страница 163: ...be returned Default values for events returned are set to 10 000 for live events and 1 000 for each event snapshot The number of events listed in the summary is displayed at the bottom of the Event Summary unless there is more than the default number of events If this is the case and you want to show more than the default num ber of events you can change the maximum number of events returned on th...

Страница 164: ...tem generated ACK Alarm acknowledged ACK PNT All alarms on a point acknowledged at the same time That is the user has selected an object on a schematic and pressed the Ack key Each alarm that was acknowledged is journaled as is the summary ACK PNT event For example for a point with PVHI and PVHIHI alarms active three events are journaled ACK for PVHI ACK for PVHIHI and the ACK PNT summary DISCARD ...

Страница 165: ...ts that appear on the Event Summary see Understanding display call up events on the Event Summary in the Station Configuration Guide About journaled events Journaled events are events associated with a journaled alarm or alert A journaled event is indicated on the Event Summary display by a J in its Priority value Previously journaled events from a remote server could only be viewed by running an ...

Страница 166: ...e or snapshot can be returned Default values for events returned are set to 10 000 for live events and 1 000 for each event snapshot The number of events listed in the summary is displayed at the bottom of the Event Summary unless there is more than the default number of events If this is the case and you want to show more than the default number of events you can change the maximum number of even...

Страница 167: ...ane use either method 1 Choose one of the following l Click the Hide Location Pane icon l Click the Close icon in the Location Pane To filter using the Location pane 1 Show the location pane if it is hidden 2 Expand the asset tree to locate the item by which you want to filter 3 Click the required item s Events are filtered to show any events for the selected item s Responding to events Honeywell ...

Страница 168: ...ered or sorted the column by which you are filtering or sorting is highlighted You can change the Event Summary to show all events for the current day and for each of the last seven days using the Date Time filter You can also do a custom time based filter To filter the Event Summary 1 Call up the Event Summary display 2 Click the column heading you want to filter by 3 Select the filter you want t...

Страница 169: ...limited filtering capabilities in the default view and you cannot sort the default view n all today s events snapshot shows all events that occurred today up until the view was applied There may be other views that have been configured for your system Ask your supervisor or an experienced colleague about other views and what information they display in the Events Summary Sorting the Event Summary ...

Страница 170: ...ously been applied clicking Clear All Filters does not reset the summary back to the default view Rather all filters are cleared and the view name is shown with an asterisk indicating it that the view has been modified Example scenario sorting the Events Summary You want to sort the Events Summary so that events are listed in ascending order according to point ID 0 9 A Z Solution 1 Call up the Eve...

Страница 171: ...plays the comment in the description column Comments can also be included in an Alarm and Event report To add a comment to an event 1 Select the event to which you want to add a comment 2 If the Details Pane is not visible click the Show Details Pane button 3 Click the Comments tab Any existing comments that are added to the event are displayed Tip Once an event has been archived no further commen...

Страница 172: ... type of operator added event that can be selected as a sort criteria when events are displayed To manually add an event to the Event Summary 1 Do one of the following l Click the Generate Event button on the toolbar then type the comment into the message zone l Click the Generate Event button on the Event Summary display then type your comment into the message zone Using Event Archiving Event Arc...

Страница 173: ...tion of each status see the table below Current event rate Hourly average calculated on the previous 24 hours Is updated every hour Last archived The last date and time that an archive ran Next archive scheduled for The date and time of the next schedule archive Calculated using the last archive date and time and the configured schedule The following table describes each possible archive status Ar...

Страница 174: ...vents so that you can access them Restoring archived events from tape You cannot restore archives from tape using a Station on a client computer If you are restoring archives from tape you must use Station on the server computer When restoring archives from FileSystem use a UNC path rather than mapping a drive to your local computer For example use myserver archive instead of f To restore archived...

Страница 175: ...er than mapping a drive to your local computer For example use myserver archive instead of f To restore archived events from FileSystem 1 Click the Restore button 2 Select the required dat file 3 Click Open Checking event records for tampering Information about events is stored in your database in an encrypted format As a security measure Experion can detect if any changes have been attempted or m...

Страница 176: ...o check the entire event database for tampering on an on demand basis In either case if tampering is detected an alarm is raised If you use the Check for Tampering button to verify that the system s electronic records are secure you are prompted with a message alerting you that this could be a time consuming process depending on the size of your databases Responding to events Honeywell 2017 176 ...

Страница 177: ...ed or n Retained in the Message Summary until they are manually cleared There are four types of messages n Informational appear in the Message Summary with a flashing icon n Confirmable appear in the Message Summary with a flashing icon n Single signature appear in the summary with a flashing icon To acknowledge and confirm this type of message you must provide your electronic signature n Double s...

Страница 178: ...ary 1 Choose ViewMessages Message Summary Message Summary columns The following table describes the default message line items starting from the left Column Description Icon Meaning Message state Informational message Confirmable message Message requiring a single electronic signature Responding to messages Honeywell 2017 178 ...

Страница 179: ...essage condition Item The item name of the point where the message was generated Location The full path name of the asset to which the point or device belongs Location Item The item name of the asset to which the point or device belongs Quality The message quality Changing what is shown in the Message Summary Attention Depending on your security privileges you may not be able to filter and sort th...

Страница 180: ...e Summary Filtering the Message Summary allows you to show messages that match the filter criteria and hide messages that do not match the filter criteria For example you can filter the Message Summary to show messages of the type informational only Sorting allows you to set the order in which messages appear in the summary The sort order can be ascending or descending For example you can sort mes...

Страница 181: ...ick the column heading you want to sort by 3 Select the sort order To remove sorting and column filters 1 Click Clear all Filters Any sorting and or column filters applied to the summary display are removed Tip If a custom filter has previously been applied clicking Clear All Filters does not reset the summary back to the default view Rather all filters are cleared and the view name is shown with ...

Страница 182: ...n all messages shows all messages n confirmable messages shows confirmable messages only n informational messages shows informational messages only Your system may be set up with site specific views Ask your supervisor or an experienced colleague about other views and what information they display in the Message Summary To apply a view 1 Click the view list 2 Select the view from the list Navigati...

Страница 183: ...nt instance the message time will be shown with a strikethrough only The old time will be retained to keep the message s position in the message list from changing The message icon will update to reflect the new message To pause the Message Summary 1 On the Message Summary display click Pause Resetting the Message Summary A Reset View button is available on the toolbar of the Message Summary displ...

Страница 184: ... with an IKB or OEP keyboard press the ACK key Depending on the configuration of your system you may be prompted to confirm your action The way in which you acknowledge and if necessary confirm a message depends on the type of message You can also click the Acknowledge Page button to acknowledge all messages in the display except those that require electronic signatures If this type of icon is to ...

Страница 185: ...knowledge a message 1 Right click the message and choose Acknowledge Message The icon stops flashing 2 Right click the message again and choose Confirm Message Depending on how your system is configured the message l Is removed from the Message Summary when it is acknowledged and confirmed or l Remains on the Message Summary until it is manually cleared To manually clear a message right click the ...

Страница 186: ... Is removed from the Message Summary when it is acknowledged or l Remains on the Message Summary until it is manually cleared To manually clear a message right click the message and choose Clear Message Acknowledging a message that requires two electronic signatures A message that requires two electronic signatures to be acknowledged is identified by a flashing icon An electronic signature is the ...

Страница 187: ...cur ity level is shown in the Secondary signature tab 11 Type your user name and password and domain if required 12 If required type any additional comments under Comments 13 Click OK Confirmation is sent to the controller and an event is generated recording your names as the signers Depending on how your system is configured the message l Is removed from the Message Summary when it is acknowledge...

Страница 188: ...al message is selected on the Message Summary When you clear the page in this way you are asked to confirm that you want to clear the page of messages Adding comments to a message If required you can add comments to messages in the Message Summary For example you might need to add details about your response to a message To add a comment to a message 1 Select the message to which you want to add a...

Страница 189: ...ipe A has been rising steadily over the last couple of days most probably due a build up of waste particles on the inner lining This is leading to a degradation in process performance An alert is raised to indicate that pipe cleaning must take place in the next week Tip The Alert box in the Status Bar flashes white if there are any unacknowledged alerts The Alert Summary Alerts are listed in the A...

Страница 190: ...the alert is unacknowledged and the cause of the alert no longer exists Flashing The alert is unacknowledged and disabled Date Time The time and date at which the alert was received Location Tag The tag name of the asset to which the point or device belongs Source The point or device that caused the alert If the point ID is too long to be fully displayed in the alarm summary it is truncated To see...

Страница 191: ...ters and sorting the summary Filtering the Alert Summary allows you to show alerts that match the filter criteria and hide alerts that do not match the filter criteria For example you can filter the Alert Summary to show alerts for a particular asset only You can filter the Alert Summary by most columns in the summary Sorting allows you to set the order in which alerts appear in the summary The so...

Страница 192: ...in to dock the Location pane To hide the Location pane 1 Choose one of the following l Click the Hide Location Pane icon l Click the Close icon in the Location Pane To filter using the Location pane 1 Show the location pane if it is hidden 2 Expand the asset tree to locate the item by which you want to filter 3 Click the required item s Alarms are filtered to show any alarms for the selected item ...

Страница 193: ...rts shows alerts for which the current operator is the author as well as any alerts marked as public There may be other views that have been configured for your system Ask your supervisor or an experienced colleague about other views and the information they display in the Alert Summary To apply a view 1 Click the view list 2 Select the view from the list Resetting the Alert Summary A Reset View b...

Страница 194: ...utton The alert disappears from the current view and is only visible if you select the shelved alerts view Unshelve an alert on the Alert Summary Select the shelved alerts view select the alert you want to unshelve and click the Unshelve Alert button The alert disappears from the shelved alerts view and returns to the normal alert views Responding to an alert with Interactive Instructions If the a...

Страница 195: ...e the new notification Generally alerts are discarded before alarms and low priority alarms are discarded in deference to similar higher priority alarms When alarm or alert 15000 is generated the alarm indicator on your Station status bar will change to OVERFLOW In addition to the alarm overflow indicator a Recover Alarms button will appear on the corresponding summary display If an alarm overflow...

Страница 196: ...ummary display that you want to export 2 If appropriate filter the display to show only the data you want to include in the CSV file 3 Click Export to CSV to export the summary display as a CSV file A CSV file is created with a name that identifies the date it was created and the summary display that the data came from For CSV exports requested from flex stations the CSV file is saved on the prima...

Страница 197: ...Experion PKS Server Data Report SummaryReports folder where data folder is the location where Experion is stored For default installations data folder is C ProgramData Exporting what is shown in a summary display Honeywell 2017 197 ...

Страница 198: ...current value of each parameter for a particular point You can also use a Point Detail display to disable the point or change parameter values providing you have the required security level Point Detail Displays have a standardized layout as shown in the following figure The Faceplate is designed to look like a traditional panel instrument and shows the main parameters for the point The other para...

Страница 199: ...ct To call up a detail display for the point in the Alarm Line 1 Select the alarm associated with the point 2 Click the Detail toolbar button To call up a detail display for a point whose ID or the first part of it you know 1 Type all or part of the point ID in the Command Zone and then click the Detail toolbar button 2 If you typed only part of the ID a list of matching points and other items app...

Страница 200: ...ge the point s properties Caution Changing point properties in Station will not update the Quick Builder project Honeywell recommends that after updating the point in Station you upload it into Quick Builder to synchronize the project Faceplate Shows critical information about the point and provides a convenient means of controlling the point Many faceplates look like the front panels of the field...

Страница 201: ...fy the value at which the physical counting or totalizing mechanism on the device or controller rolls over Note that regardless of this physical rollover value the accumulator point PV continues to increase indefinitely until it reaches its maximum value or until it is reset by an operator Services Scanning and control enabled Enable and disables scanning and control of the point You typically nee...

Страница 202: ...cans of the parameter In Station this value is read only Dynamic Scanning When selected dynamic scanning is enabled for the parameter In Station this check box is read only Controller The controller to which this parameter is attached Click the controller name to display the controller s detail display Source Address The source address of the parameter In Station this value is read only Timestamps...

Страница 203: ...the alarm is raised On Delay sec The delay time in seconds that must pass before an alarm is raised Off Delay sec The delay time in seconds that must pass before an alarm returns to normal RTN Priority Lists the priority of the alarm Options in order from the lowest priority are n Journal n Low n High n Urgent If critical alarm support has been enabled urgent priority alarms with a sub priority of...

Страница 204: ...he appropriate security level you can change the point s properties Caution Changing point properties in Station will not update the Quick Builder project Honeywell recommends that after updating the point in Station you upload it into Quick Builder to synchronize the project Faceplate Shows critical information about the point and provides a convenient means of controlling the point Many faceplat...

Страница 205: ...eyboard Alarms enabled Enables and disables all alarms for the point This check box overrides each of the Enable Alarm check boxes for each state which are located on the Alarms tab Journal only option When selected handles all alarms for the point as journaled events Note that Alarms enabled must be selected for this option to work Manual PV When selected the operator is permitted to change the P...

Страница 206: ... 0 if it is less than the PV clamp low limit Similarly the PV will be clamped at 100 if it is greaterthan the PV clamp high limit The high and low limits for the PV clamp are defined on Point Processing tab on the Message Point Processing display The values are entered as a percentage of the point range OP Reverse Reverses source and destination parameter values MD Reverse Reverses the mode parame...

Страница 207: ...ontroller When in CASC mode operators cannot change either the SP or OP n COMP Computer mode Only applicable to a TDC controller Used when the SP comes from a computer that is performing automatic control When in COMP mode operators can change either the SP or OP Mode Check Disabled If selected operators can parameter values regardless of point s mode If cleared the server checks the mode before a...

Страница 208: ...g point to indicate when the PV goes beyond the limit you specify The types of PV limit alarms for analog points are n PV High n PV HiHigh n RateOfChange Limit The value for each of the eight PV limit alarms at which the alarm is raised On Delay sec The delay time in seconds that must pass before an alarm is raised Off Delay sec The delay time in seconds that must pass before an alarm returns to n...

Страница 209: ...d low limits for unreasonable values are defined on Point Processing tab on the Message Point Processing display The values are entered as a percentage of the point range Control Failure Alarms PV Control Fail Alarm The Priority and Subpriority values for the PV control fail alarm Control Timeout The maximum time in seconds allowed after a change in SP or OP for the PV value to reach an acceptable...

Страница 210: ...itiated from the server Alarm message Alarm Message Index The index number of the message associated with alarms for this point For details about creating messages see the Station Configuration Guide History tab The History tab displays changes to the point s process value PV over time Auxiliary tab The Auxiliary tab is for monitoring and controlling the auxiliary A1 A4 parameters The display prov...

Страница 211: ... a particular set of parameters click the appropriate Tab If you want to display changes in PV over time see Displaying point history Status point A status point is a standard point type with a fixed data structure that represents digital inputs or outputs For example a status point can represent the on and off states of a pump If you have the appropriate security level you can change the point s ...

Страница 212: ...s read only Services Scanning and control enabled Enable and disables scanning and control of the point You typically need to disable a point if the associated device is being serviced or repaired this prevents misleading alarms being generated In addition to using this check box you can also click Enable Disable on the toolbar or press F11 or LOAD on an OEP IKB keyboard Alarms enabled Enables and...

Страница 213: ...oller to which this parameter is attached Click the controller name to display the controller s detail display For status points that use non consecutive bit addresses each parameter bit will link to its particular controller Source Address The source address of each parameter For the PV parameter the address can contain up to three non consecutive bit addresses For the OP parameter the address ca...

Страница 214: ...e the output value n MAN Manual mode The operator is permitted to change either the SP or OP n CASC Cascade mode Only applicable to S9000 TDC and UDC con trollers Used when the SP comes from the output of another PID loop within the controller When in CASC mode operators cannot change either the SP or OP n COMP Computer mode Only applicable to a TDC controller Used when the SP comes from a compute...

Страница 215: ...t priority are n Journal n Low n High n Urgent If critical alarm support has been enabled urgent priority alarms with a sub priority of 15 will be shown as critical priority alarms on the Alarm Summary and other displays For information about how to enable critical alarms see Customizing alarm colors in the Station Configuration Guide On Delay sec The delay time in seconds that must pass before an...

Страница 216: ...han None to enable the control fail alarm External Change Alarms PV If selected an alarm is raised if the PV parameter changes without the change being initiated from the server Output If selected an alarm is raised if the OP parameter changes without the change being initiated from the server Mode If selected an alarm is raised if the MD parameter changes without the change being initiated from t...

Страница 217: ...so on Sequential control module SCM detail displays contain a faceplate on the left hand side and a series of tabs that contain more detail about the SCM From the SCM detail display you can view the SCM as a chart or as a table Chart view An SCM contains transition block and step block pairs In general when a certain transition condition is met the step procedure is executed The chart view gives y...

Страница 218: ...Blue The Transition is complete Transition conditions Green The condition is true Background The condition has not been met Red The condition is failed or in error Yellow Warning Step block Gray The step block is waiting for the conditions in the preceding transition block to become true for it to run Green The step block is running Blue The step block has completed Displaying detailed process inf...

Страница 219: ...tep that is highlighted in the Summary pane Any interactive instructions are also provided in this pane Minitrend pane Up to eight values can be trended on a Minitrend If history collection is configured for the current value and history collection type is specified in step configuration the Minitrend can retrieve old values For all other current values Minitrend starts to collect the values when ...

Страница 220: ...eplate is similar to the left hand portion of the matching point detail display Each group is identified by a number and generally has a descriptive title To call up a group detail display by choosing it from list of groups 1 Choose View Group Summary to see the list of groups 2 Select a group To call up a group detail display whose number you know 1 Click Group 2 In the Command Zone type the grou...

Страница 221: ...including n Line graphs the default n Bar graphs n Numerical list of historical data n X Y plot of the value of one point against another that is one point on the x axis and the other on the y axis Each trend is identified by a number and generally has a descriptive title Attention Note that you cannot call up trend numbers 2901 to 3000 as these numbers are used for alarm trackers If you try to ca...

Страница 222: ... Zone type the trend s number and press ENTER Typical trend Trend buttons reference Having called up a trend you use the various buttons on the trend display to modify it The following table describes each button Attention This topic is not applicable to limit trends For more information about limit trends see Limit trend controls Displaying detailed process information Honeywell 2017 222 ...

Страница 223: ...splays the scale for the plot that is shown in the box Display as bar graph The selected point is displayed as a bar graph Data for the remaining points is obscured by the bar graph Click the arrow to change from a bar graph to a line graph Display as line graph The plots are displays as line graphs Click the arrow to change from a line graph to a bar graph View trend only Indicates the current vi...

Страница 224: ...uses the trend so that data is not updated Resume live updates Restores the trend so that it is updated with live data Remove reference line Removes the reference line Reset zoom level Resets the zoom level Zoom in Zooms in by 25 of the visible range If a reference line is visible the zooming is centered around the reference line Zoom out Zooms out by 25 of the visible range If a reference line is...

Страница 225: ...splays However they also include information about relevant limits that have been sourced by integrating Experion with Limit Repository When configuring a Limit trend you can specify the required history interval to be viewed History intervals are the periods between snapshots and the periods over which averages are calculated These periods are then used for collecting history The number of trends...

Страница 226: ...s Limit trends are designed so an operator can change the way information is displayed directly in the limit trend display When viewing limit trends in Station use the various controls on the display to change the trend The following table describes the controls that are available on the default limit trend Control Description Individual scales in EU Scaling used in the trend is separate for each ...

Страница 227: ...u are not using single scale no scale will be shown on the Y axis This button is made available when you select a plot Click this button to toggle between seeing all the limits defined for the point Advanced limits or the Default limits that were specified when integrating Experion with Limit Repository You can click this button to toggle between showing the legend at the bottom or left of the tre...

Страница 228: ... or out to zoom Note that when you use a mouse scroll wheel the limit trend will zoom in both x and y axes simultaneously around the cursor point When viewing a limit trend on a touch screen you can tap and hold where you would normally use a mouse to right click For example to call up a shortcut menu Changing the scale on a trend When viewing a standard trend you can change the scale that is used...

Страница 229: ...olbar button at the top of the trend and select Single scale for all plots The button shown depends on the type of scale currently in use for the trend 3 On the y axis type the low and high scale value Scale options The following table describes all the scale options available for a standard trend Scale option Description Individual scales in EU You specify the maximum and minimum value that will ...

Страница 230: ...plots Adjusts all plots that are currently visible so that they are centered vertically in the chart and scaled such that each plot uses most of the vertical chart space Scale to point ranges in EU The scale is set so that it correlates with the maximum and minimum point parameter range of all points in the trend and is shown in engineering units Scale to point ranges in The scale is set so that i...

Страница 231: ...ur trend display 2 Click the View trend with events button 3 Filter the Event Summary as required Tip If you find a correlation between an event and changes in values in the trend you can add comments to the event Changing the period on a trend To change the period you specify the length of time for example 2 hours and then specify which 2 hours you want to see Tip For information about how to cha...

Страница 232: ...o mouse over the plot when the reference line intersects the plot to obtain the reference value To add a reference line to a trend you are viewing 1 Click on the chart area of the trend Tip To move a reference line drag the line to the required point To remove the reference line on a standard trend click the Remove reference line button Zooming in on a trend display If you want to focus on a parti...

Страница 233: ...cancel the selection of a plot on a limit trend you can click on the plot select another plot or select All plots To control the highlight of a plot on a standard trend 1 Do one of the following l In the plot list above the chart area select the box to the left of the trend name To remove the highlight select the check box again l In the legend select the Pen check box for the trend plot To remove...

Страница 234: ...play for that controller Status Icons and text to indicate the status of the controller Controllers with dual links display icons for both links and a text aggregate of the two values For example a combination one disabled link and one enabled link will have a text value of Marginal Possible status values are OK Marginal Failed Unknown Should a remote server become disconnected or disabled its cha...

Страница 235: ...s the status of every channel and server The Filter by status options enable you to filter the list of controllers by one or more status values You can filter by one server channel or asset but by multiple status values The numbers beside each status value indicates the number of controllers of that status for the selected server channel or asset These numbers will update according to any filterin...

Страница 236: ...ed out of service or has failed In addition when collecting configuration log data dynamic scanning must be enabled on the controller Displaying EFM meters Calling up a Meter Detail display To call up a Meter Detail display 1 Use any of the following methods to call up a Meter Detail display for an individual meter l From the System Status display double click on the meter in the location pane l I...

Страница 237: ...Detail displays The Meter Detail display is where you review the meter status and control data collection and export for an individual meter You can call up this display using any of the following methods n Double clicking an alarm for the meter point n Right clicking on an alarm for the meter point and selecting Detail Display n Double clicking on the meter in the location pane on the System Stat...

Страница 238: ...logs n Configuration logs n Configuration Record logs n Liquid Batch logs n Audit logs and the status of data Export Attention Timestamps in this section are as observed from the locale of the computer on which Station is running For example if a collection occurred at 2 00 AM according to the server and Station is running in a time zone one hour ahead the timestamp will show the collection as hav...

Страница 239: ...xport for all configured data export formats Next scheduled Applicable to collection logs only The date and time of the next scheduled data collection for the corresponding log type on the meter If a collection type is not scheduled for collection the next collection field will show Not configured Error statistics This area displays statistical information for the available logs n Interval logs n ...

Страница 240: ...umber of errors and percentage of errors for all collection and export types Use this when troubleshooting meter issues Manual request Item Description Request latest data from meter Collects data from the meter outside of its regular collection schedule It collects all data since the last successful collection Use this task when commissioning the meter or when a previously failed meter comes back...

Страница 241: ...aged out Use this task when data has been successfully exported but has since been lost and needs to be recovered Note that this task exports data from one meter To perform the same task for all meters on one server use the Rerun data export option on the Electronic Flow Measurement configuration display See the topic titled EFM configuration settings in the Station Configuration Guide for more in...

Страница 242: ...s are n OK n Retrying n Failed 3 Alarm Zone Shows the most recent highest priority unacknowledged alarm Click Alarm Acknowledge to acknowledge the alarm 4 Control Zone Enables and disables the EFM meter Resetting statistics on the Meter Detail display This task resets the diagnostic information number of requests number of errors and percentage of errors for all collection and export types Use thi...

Страница 243: ...d Otherwise this option is disabled To request a manual collection of data from an EFM meter 1 Call up the meter in the Meter Detail display 2 Click Request latest data from meter The system requests a full collection of all data since the last successful collection Requesting a manual export of data from an EFM meter Choose one of the following export tasks Export task Description Latest collecte...

Страница 244: ...To export the latest collected data 1 Call up the meter in the Meter Detail display 2 Click Export latest collected data The system exports all collected data that was not previously exported To export all collected data from a specified date 1 Call up the meter in the Meter Detail display 2 Click to display the date picker 3 Select the date from which you want to export data up to the last 31 day...

Страница 245: ...ed procedure terminology You will not see the term activity in your interface Your summary display will be the Procedure Summary display Activities An activity is a generic term used by the Experion system which can apply to a batch or a procedure and is used when both are configured in the same system If you run both batches and procedures at your site your interface will be customized to use gen...

Страница 246: ... by clicking on an activity which is in the Exec state in the Activity Summary display and then expanding the list next to the Command menu option The available commands are n Start n Reset n Abort n Hold n Restart n Stop Activity stages and states Activity stages are a set of states that apply to all batches and procedures n Init initializing n PreExecution n Executing About activities batches an...

Страница 247: ...r more of the following n 0 Loading n 1 Loaded n 2 Inactive n 3 Validated n 4 Running n 5 Complete n 6 Checking n 7 Idle n 8 Interrupting n 9 Interrupted n 10 Restarting n 11 Restarted n 12 Holding n 13 Held n 14 Stopping n 15 Stopped n 16 Aborting n 17 Aborted n 18 CommErr n 19 Blank n 20 Starting n 21 Started About activities batches and procedures Honeywell 2017 247 ...

Страница 248: ...rted Stopped terminal Stopped non terminal Only valid when state Aborting or Aborted Batch commands While a batch or procedure is in one of the states a set of batch commands are available to provide interaction with the activity entity RCM or SCM associated with this batch or procedure These batch commands are not context sensitive a message will be displayed in the message zone if an invalid com...

Страница 249: ...n Restart n Hold n Stop n Abort n Resume n Active n Cancel About activities batches and procedures Honeywell 2017 249 ...

Страница 250: ...base your batch or procedure n Higher operator security access than View Only or Ack Only n The appropriate asset permissions to the point against which the recipe or procedure RCM SCM or Class Based Recipe has been created Lastly when viewing the relevant summary display the items that you will see are also filtered according to your SOR To be able to view a particular batch or procedure you must...

Страница 251: ...ummary Depending on your Experion configuration you will see an activity batch or procedure version of the summary display Regardless all of the summaries have the same interactive elements as shown here Summary display showing interactive elements 1 2 3 4 5 Item Description 1 Activity command buttons Can be used to command a batch or procedure Available commands are Start Hold Stop Remove Abort 2...

Страница 252: ...e has been used to create a batch or procedure 4 Navigation links Enables navigation to the displays related to this batch or procedure You can use these links to view information about the activity Navigate first to the activity s Detail Display then select the Resources tab 5 Command lists Provide the ability to n Issue standard RCM SCM commands to the selected batch or procedure n View and cont...

Страница 253: ...summary display from the Station menu 1 From the missing or bad snippet View menu select one of the following options Station menu options for Activity Batch and Procedure Summaries a Activity Summary which will display the generic version of the display showing a combination of batches and procedures b Batch Summary which will display the batch version of the display showing only batches and usin...

Страница 254: ...ontrol builder Asset The asset that the batch or procedural operation is associated with Unit The unit that the batch or procedural operation is associated with Type Activity Summary only Will be either Batch or Procedure Description Descriptive text about the batch recipe or procedural operation Stage The current point of the batch or procedural operation in the lifecycle Valid values are Pre Exe...

Страница 255: ...atch or procedure option Tip From Batch or Procedure Summary displays clicking New automatically invokes a different theme within the Details Pane using either batch or procedure related terminology The details pane will change from displaying the usual General tab to a pane containing fields where you can create a batch or a procedure The title of this new pane will be one of the following depend...

Страница 256: ...ocedure from a custom display You can build custom displays that can create batches or procedures for correctly configured assets Assets supporting batch or procedure creation will have a Create Activity button beside them Tip If you want the Create Activity dialog box to always be visible click the Push Pin otherwise it will close when you call up another display To create a batch or procedure fr...

Страница 257: ...or procedures to those associated with that asset You can filter the recipe list further by typing characters into either the Recipe or the Public Name box Tip Batch ID is mandatory for a batch but optional for a procedural operation Create Batch dialog box showing filtering on recipe name 3 Select one or both of the available options a Automatically Start Activity will move the batch or procedure...

Страница 258: ...access the General tab n Header Parameters enabling editing of data such as the default batch size current batch size and scaling factor n Formula Parameters enabling editing of the different formula input values n Report Parameters enabling editing of the data to be included in batch reports n Units enabling editing of parameters for batches using class based recipes the Units tab is only shown w...

Страница 259: ...at the bottom of the window 3 Continue to provide new parameter values as required including on other tabs Tip Click Clear at any time to remove any values entered into the New Value boxes The Report Parameter tab contains data you would probably only use after the batch or procedure has completed 4 Click Apply to send your parameter changes to the control module and then you can manually start th...

Страница 260: ...want the Activity Data dialog box to always be visible on a custom display click the Push Pin otherwise it will close when you call up another display To edit the batch or procedure parameters from a custom display 1 From the Activity Data dialog box select the tab corresponding to the type of para meter you want to change 2 Review the Master Value the default value and the Control Value the curre...

Страница 261: ...ustable parameters check box at the bottom of the dialog box 3 Continue to provide new parameter values as required including on other tabs 4 Click one of the buttons provided a Clicking Start will send the values to the controller and automatically start the batch or procedure b Clicking Apply will send the values to the controller and then you can manually start the batch or procedure using the ...

Страница 262: ...r at once When an error has occurred an icon is displayed on the Parameter tab containing the errors as shown below Values that are not in error are stored successfully Error icon indicating error on Formula Parameters tab To respond to a control value error 1 From the details pane or Activity Data dialog box in a custom display select the tab containing the error icon The number of errors within ...

Страница 263: ...ply to send the updated values to the controller Electronic signing of parameter values If the RCM or SCM used to create the batch or procedure had Electronic Signature enabled the Electronic Signature dialog box will display when you try to apply parameter values Electronic Signature dialog showing current and new parameter values Editing a batch or procedure Honeywell 2017 263 ...

Страница 264: ...h parameter 2 Enter your details to sign to accept the changes you only need to perform this step once for all of the parameters being applied rather than for each individual parameter 3 Click OK to electronically sign the values An event will be raised for the transaction and individual events will be raised for each parameter that has been updated Editing a batch or procedure Honeywell 2017 264 ...

Страница 265: ...ods Summary display showing interactive command elements 1 2 3 Item Description 1 Activity command buttons Commands supported are Start Hold Stop Abort Remove 2 Contextual menu options Accessed by right clicking on a batch or procedure 3 Command lists Provide the ability to n Issue standard RCM SCM commands to the selected batch or procedure n View and control the mode setting of the selected batc...

Страница 266: ...om either the summary display or the activity table on a custom display select a batch or procedure in a Pre Exec state that you would like to start 2 Click the Start at the bottom left of the summary grid If you do not have a set of activity command buttons you can access the activity commands by right clicking on the batch or procedure in the Activity table The batch or procedure moves into the ...

Страница 267: ...e in the Activity table The batch or procedure moves back into the Exec Running state Stopping a batch or procedure When a batch or procedure is executing you can Stop it from either the summary display or from an activity table on a custom display To stop a batch or procedure 1 From either the summary display or the activity table on a custom display select a batch or procedure in a Exec state th...

Страница 268: ...ct the batch or procedure to be aborted 2 Click the Abort at the bottom left of the summary grid If you do not have a set of activity command buttons you can access the activity commands by right clicking on the batch or procedure in the Activity table The batch or procedure moves into the Aborted state Executing an activity batch or procedure from a custom display A set of controls has been creat...

Страница 269: ...d to be specific colors so the command drop down controls in your system may look different to the one shown here Command panel control The command panel control groups related basic or list type command controls to make it easier to interact with a procedure The following image displays a command panel control for a confirmable instruction The Operator icon indicates that Operator interaction is ...

Страница 270: ...ions and notes configured but in the example shown here only the instructions are active Confirmation panel control The background and foreground colors of the control label can be configured to be specific colors so the confirmation panel controls in your system may look different to the one shown here Information control The information control contains details or warnings steps instructions or ...

Страница 271: ...the need for Operator interaction An icon to the right of the instruction text if configured indicates the status of the instruction The following image displays an example of an instruction control that has been confirmed by the Operator as indicated by the selected check box Instruction control The background color of the name description text is white when the instruction is active or requiring...

Страница 272: ...ttribute button control The background and foreground colors of the control label can be configured to be specific colors so the mode attribute button controls in your system may look different to the one shown here Mode attribute drop down control The mode attribute drop down control provide a way for the Operator to view the current mode attribute value and set the desired value The value as sho...

Страница 273: ...trol The background and foreground colors of the control label can be configured to be specific colors so the mode button controls in your system may look different to the one shown here Mode drop down control The mode drop down control shows the current mode value for a procedure and also enables selection of the desired mode value The following image displays an example of a mode drop down contr...

Страница 274: ...uence controls to indicate the state and execution status of the associated SCM RCM or UCM The same icons are also used within the Activity Batch Procedure summary displays to indicate the activity batch or procedural operation state Depending on the position of the icon within the control it conveys different meanings The following image shows the structure of a procedure and sequence control and...

Страница 275: ...values see the Status Icon table that follows 5 Procedural level icon The Procedure Level icon indicates the S88 procedural level of a phase or unit For details of the possible procedure levels see the Procedural Level Icon table that follows Procedure and sequence control elements continued State icons The following table describes how procedure and sequence control state icons change to reflect ...

Страница 276: ...ed Execution status icons The following table describes how procedure and sequence control status icons change to reflect the execution status of the associated SCM RCM or UCM If the icon looks like this The control is Awaiting confirmation of an instruction In an Info execution status No Operator action required In a Warning execution status Operator action may be required In an Error execution s...

Страница 277: ...ral level is Procedure Unit Procedure Operation Phase SCM Unspecified Procedural level icons and their meanings Invalid state visualizations All of the Procedure and Sequence controls can experience an Invalid state There are two separate visualizations used to communicate these states If the control looks like this The invalid state being experienced is Invalid configuration This could occur due ...

Страница 278: ...croll buttons are provided to enable scrolling through the procedures The names displayed in the procedure list control are the public names of the procedures The following image displays a list of four procedures two of which are running Resin TankCleanup one which has completed Blend 102 and one which is stopped RCM257 The Resin procedure is also awaiting Operator confirmation of an instruction ...

Страница 279: ...ly steps or phases rather than a mix of both the title will change to reflect the control type and be either Steps or Phases The following image displays a list of steps and phases n The step called OpenValves and the Premix phase are complete n The step called DrainTanks and phase called Wash are running The DrainTanks step has a warning status and may require Operator attention The Wash phase is...

Страница 280: ...is active or requiring Operator interaction When the background is light gray the transition is idle completed or otherwise inactive Transition list control The transition list control contains a set of transition controls If there is a lot of transition controls contained in the list scroll buttons are provided enabling the Operator to scroll through the controls This control contain transitions ...

Страница 281: ...it is active or requiring Operator interaction When the background is light gray the unit is idle completed or otherwise held stopped or aborted Unit list control The unit list control contains a list of Units UCMs If there is a lot of units in the list scroll buttons are provided to enable the Operator to scroll through the units The following image a list of unit controls Two are active with pro...

Страница 282: ...ure you can perform the following actions n Monitor batch or procedure progress n Change the batch or procedure parameters n Adjust formula parameters n Review report parameters n Command batches or procedures n Interact with a confirmable instruction Activity Detail display Operating a batch or procedure Honeywell 2017 282 ...

Страница 283: ...e field provided and press Enter to submit the change to the controller To adjust formula parameters from an activity detail display 1 From the Activity Detail display click the Formula tab to display the formula para meters for this batch or procedure 2 Type new values for the parameters as required and press Enter to submit the changes to the controller To review report parameters from an activi...

Страница 284: ...t The parent child concept in a layered recipe is completely different from the parent child relationship in the user defined template function To access a child element 1 Select a batch or procedure from the summary display 2 Click on Detail Display to display the Activity Detail display for the selected item Activity Detail display a Click the Active Phases tab to display the child elements for ...

Страница 285: ...could potentially prevent another batch or procedural operation from proceeding You will be alerted to the existence of orphaned activities by a system alarm raised on the server system point The alarm will return to normal when there are no more orphan activities in the system To manage an orphaned activity 1 From the Alarm Summary double click the alarm indicating the existence of the orphan act...

Страница 286: ... entry fields Mouse over the boxes to see tool tips containing limit information if it has been configured If you enter a value outside a configured limit an error is returned Report Parameters tab showing limit values for a parameter 4 Click Apply to send the values to the controller You can then manually start the batch or procedural operation using the command buttons provided Reviewing report ...

Страница 287: ...events are generated when a batch or procedure starts or changes state The events are generated by the controller rather than the Activities sub system itself You can use the Events Summary display to monitor and review batch and procedure events You could also use the Procedure Analyst product for more detailed analysis To review batch and procedure events 1 From the Activity Summary display navi...

Страница 288: ...erequisites n To load a recipe you need to know the unique two digit number for each unit Ask your supervisor or plant engineer for the required unit numbers To load a recipe 1 Choose ActionLoad Recipe to see the list of recipes The Recipe Summary 2 Click the recipe you want to load The recipe s details appear 3 If you want to change the recipe before loading it customize it now 4 Type the unit se...

Страница 289: ...ly you may need to override some of the recipe s master values for the particular task you are about to perform To scale a recipe 1 Click the Scale box and type the scale percentage 100 uses the master values whereas 50 halves them Note that scaling only affects the parameters for which Scaled is set to Yes To override one or more master values 1 Select the appropriate Working box and type the app...

Страница 290: ...g n Diagnose problems in the system n Review firmware versions for C300 controllers Calling up the System Status display There are several ways to call up the System Status display n Using the Station menu n Using the Station Status Bar usually in response to a system alarm To call up the System Status display using the Station menu 1 In Station choose ViewSystem Status Display To call up the Syst...

Страница 291: ...ashboards by closing the location pane Enable layout persistence to preserve this arrangement System Status display Dashboard pane reference The displays shown in the Dashboard pane are known as dashboards Dashboards can be configured to provided graphical information about the status of your system and network components in a way that allows relationships and criticality to be represented You can...

Страница 292: ...at have been added to the tree the other shows all of the Experion related components such as servers Stations channels and controllers You can expand and collapse the trees as required to navigate to the component to check its status or to view alarms associated with the component If you double click a component the status detail display for that component is opened The Location pane can give you...

Страница 293: ...t of the information that is contained in the detail display for the item you have selected in the Location pane The exact information shown in the Status pane is different for each type of component the type of information available in the status pane can be n Alarm state of any alarms raised on the component as well as an alarm acknowledge button n The current state of the component n Connection...

Страница 294: ...It is similar to the Alarm Summary You can acknowledge alarms from the Results pane in the same way you acknowledge alarms in the Alarm Summary The Results pane System Status display Details pane reference The Details pane shows more details of the alarm you have selected in the summary If no alarm is selected the Details pane is empty What is the System Status display Honeywell 2017 294 ...

Страница 295: ...nt is partially functional Further investigation is required to find out what is going wrong with the component to prevent a complete failure OK The component is functioning correctly Disabled The component is either not configured not yet enabled or has been switched off Unknown The status of the component cannot be determined None The component does not support reporting its status What is the S...

Страница 296: ...leagues on the next shift about any important events To read the Message Pad 1 Choose ViewMessage Pad Alternatively click Message Pad on the System Menu To clear all existing notes and add your own notes 1 Choose ViewMessage Pad 2 Click the Clear button 3 Click in the note area Alternatively press the TAB key until the note area is high lighted 4 Start typing your note 5 When you have finished cli...

Страница 297: ...1 Choose ViewMessage Pad 2 Click below the existing note You may need to press ENTER to start a new line 3 Start typing your note 4 When you have finished click the Save button Communicating with your colleagues Honeywell 2017 297 ...

Страница 298: ...generating it For alarm events and message summaries you can use the Print As Report feature to produce a printed report containing all or a range of the summary information within the display If you simply want a printout as a snapshot of what is currently shown in Station you do not need to print a report you can print the display Tip To request a report users must be logged on as a member of on...

Страница 299: ...s SSRS to generate reports Occasionally you may experience a delay in report generation for the following reports due to the application domains in the SSRS recycling after the default period of 12 hours l Alarm and Event DSA l Fieldbus Diagnostics l Asset Alarm Count l Disabled Console Assets l OPC DA Server Usage l Performance Statistics These scheduled recycling operations are aimed at promotin...

Страница 300: ...cified time period This report enables you to analyze alarms and events that occurred during a specified time span on specific points Alarm and Event DSA Lists alarm and event details from servers within a DSA This report enables you to analyze alarms alerts and events that occurred during a specified time span on local and remote points on multiple servers Alarm Duration Lists how long the specif...

Страница 301: ...bled on the specified console or across the cluster Free Format Enables you to request customized reports that have been designed using the Free Format Report Writer option Integrated Microsoft Excel Enables you to request customized reports that have been designed using Microsoft Excel ODBC Data Exchange Enables you to request customized reports using the ODBC Data Exchange option OPC DA Server U...

Страница 302: ...icons are replaced with codes which are described at the bottom of each page Attention Print and Print Preview icons are enabled and disabled based on security settings configured for Station under Server wide settings For more information about Station security see Server wide settings in the Station Configuration Guide To print a report of what is shown in a summary display 1 Call up the summary...

Страница 303: ...Tip You can also export the report to a standard file format that can be read by other applications Producing reports Honeywell 2017 303 ...

Страница 304: ...ineering staff Station menu Command Description Connect Opens a specific Station setup file See Changing Station s setup file on page 23 Logon Allows you to type the password for a higher security level Connection Properties Allows you to view and change Station s settings Exit Exits closes down Station Edit menu These are editing commands that are of use when using the Message Pad see Communicati...

Страница 305: ...ummary See Executing batches or procedures on page 265 Events In this menu you can choose to call up one of the following n Event Summary See Responding to events on page 162 n SOE Summary n Event Archiving See Using Event Archiving on page 172 Groups Calls up the list of group displays See Using Group Detail displays on page 220 Message Pad Calls up the Message Pad See Communicating with your col...

Страница 306: ...ct Action menu Command Description Acknowledge Acknowledges an alarm Silence Silences an alarm Request Report Generates the requested report See Requesting a report on page 298 Load Recipe Loads the specified recipe See Loading recipes on page 288 Print Prints the current display to the Windows default printer on the Station computer Page Setup Displays the Page Setup dialog box where you can spec...

Страница 307: ...ye to log off Type the command Then press Description displayname Enter Calls up the display whose name is displayname pointID F12 Calls up the point detail display for the point whose point ID is pointID If you only type the first part of the point ID a list of matching points appears You then click the appropriate point to display its details Note that the Enter key can be used instead of F12 if...

Страница 308: ...o call up display 310 you would type pag 310 pf file Enter Displays the contents of file pr n pr name Enter Views the numbered n or named name report without updating the report s contents Use the rpt command if you want to update the contents print file Enter Prints the contents of file psw Enter Changes to another security level if you are using Station based security rec n Enter Changes the cur...

Страница 309: ...t If there is no associated point detail display pressing the key calls up the point search display F12 Group display for the selected object If there is no associated group you type the number of the group you want to call up in the Command Zone and press ENTER F6 Trend for the selected object If there is no associated Trend you type the number of the trend you want to call up in the Command Zone...

Страница 310: ...ue you would use the Tab key To Press Move the focus to the next selectable object or editable box TAB Move the focus to the previous selectable object or editable box SHIFT TAB Move the focus to any selectable object or editable box in the display or to move the cursor within an editable selection Arrow keys De select the object and cancel any uncommitted change ESC Note that the movement of focu...

Страница 311: ...ry display ALM SUMM or UNIT ALM SUMM System Status display SYST STATS Message Summary display MSG SUMM Console Status detail display2 CONS STATS System Menu display SYST MENU Point detail display for the selected object If there is no associated point detail display pressing the key calls up the point search display DETAIL 1 Applicable only to points with these types of parameters 2The CONS STATS ...

Страница 312: ...up other displays To call up Press A display based on its name or number SCHEM The next display upwards PAGE BACK The next display downwards PAGE FWD Navigate forward and backward between displays that you have previously called up DISP FWD does not work if you are using multi window Station PRIOR DISP or DISP BACK DISP FWD The display associated with the selected object ASSOC DISP Copy the curren...

Страница 313: ...ble message MSG CONFM Clear the selected message on the Message Summary Depending on how your system is configured this button can also be used to clear the whole page of messages if no individual message is selected on the Message Summary MSG CLEAR Enable disable the state of the selected point the point toggles state each time you press the key LOAD Lower the value of the selected object by 1 de...

Страница 314: ...e that in a SafeView multi window environment fast update applies to all displays In multi window displays you can also set fast update by clicking on the arrow button provided on the title bar When the fast update rate is set in multi window displays the arrow on the title bar will animate FAST Clear an incorrect operator entry CLR ENTR Unsupported keys By default the following keys are not used ...

Страница 315: ...p command and requires a Group number to be entered GROUP or F6 The Group History with the default interval for the selected object If there is no associated Group History pressing the key invokes the Group History command and requires a Group History number to be entered HOUR AVG The Trend for the selected object If there is no associated Trend pressing the key invokes the Trend command and requi...

Страница 316: ...lue you would use the Tab key To Press Move the focus to the next selectable object or editable box TAB Move the focus to the previous selectable object or editable box SHIFT TAB Move the focus to the next window in a multi window Station ALT TAB Move the focus to any selectable object or editable box in the display or to move the cursor within an editable selection Arrow keys De select the object...

Страница 317: ...e point toggles state each time you press the key LOAD or F11 Lower the value of the selected object by 1 default setting 1 LOWER or F10 Lower the value of the selected object by 10 default setting Lower the value of the selected object by 1 default setting above FAST LOWER ARROW or ALT F10 Raise the value of the selected object by 1 default setting Lower the value of the selected object by 1 defa...

Страница 318: ...ted item CTRL V Unsupported keys By default the following keys are not used by Experion Check with your supervisor or an experienced colleague in case they have been assigned special functions at your site If you press any of these keys a Pushbutton not implemented message appears n ALM ANNC n AM STATS n CANCL PRINT n COMM NETWK STATS n GOTO n ORG SUMM n PRINT TREND n PROC NETWK STATS n RECRD n UN...

Страница 319: ... change these details if required 3 Click Change Password The Change Password dialog box appears 4 Type the new password and press the TAB key 5 Re type the new password and click OK The new password is only accepted if the two entries are identical Faceplates with specialized behavior The following faceplates have specialized behavior Attention The auto selection behavior described in this table ...

Страница 320: ...CADA Point Faceplate Status Point Yes OP Yes Based on Mode The OP parameter is only auto selected when the faceplate is called up and the mode is MAN or when the mode changes to MAN sysdtlaga38detaila_ fp hda Process Point Faceplate American Gas Association AGA AGA 3 Orifice Meter AGA 8 Detail Setup Data No No No None Nothing is auto selected sysdtlaga38grossa_ fp hda Process Point Faceplate Ameri...

Страница 321: ... Setup Data No No No None Nothing is auto selected sysdtlaga98detaila_ fp hda Process Point Faceplate American Gas Association AGA AGA 9 Ultrasonic Meter AGA 8 Detail Setup Data No No No None Nothing is auto selected sysdtlaga98grossa_ fp hda Process Point Faceplate American Gas Association AGA AGA 9 Ultrasonic Meter AGA 8 Gross Setup Data No No No None Nothing is auto selected sysdtlannpanela_ fp...

Страница 322: ...o OP Yes OP The OP parameter is selected only when the faceplate is called up sysdtlibva_fp hda Process Point Faceplate Main IBV Block No OP Yes OP The OP parameter is selected only when the faceplate is called up sysdtlltmotora_ fp hda Process Point Faceplate LT Motor Block No OP Yes OP The OP parameter is selected only when the faceplate is called up sysdtlsolenoida_ fp hda Process Point Facepla...

Страница 323: ...fp hda Process Point Faceplate Data Acquisition Block No No No None Nothing is auto selected SysDtlDataacqa_ fp hda Process Point Faceplate Data Acquisition Block No No No None Nothing is auto selected SysDtlDevctl1a_ fp hda Process Point Faceplate Device Control Block No OP Yes OP The OP parameter is selected only when the faceplate is called up sysdtldevctla_ fp hda Process Point Faceplate Devic...

Страница 324: ... sysdtlrcma_fp hda Process Point Faceplate Recipe Control Module Yes No Yes COMMAN D The COMMAN D parameter is selected when faceplate is called up sysdtlscma_fp hda Process Point Faceplate Sequential Control Module Yes No Yes COMMAN D The COMMAN D parameter is selected when faceplate is called up sysdtlswa_fp hda Process Point Faceplate Switch Block Yes OP Yes Based on Mode The OP parameter is on...

Страница 325: ...No SP Yes COMMAN D The COMMAN D parameter is selected when faceplate is called up sysdtltota_fp hda Process Point Faceplate Totalizer Block No No Yes COMMAN D The COMMAN D parameter is selected when faceplate is called up The COMMAN D parameter does NOT retain focus SysDtlTotalizera_ fp hda Process Point Faceplate Totalizer Block No No Yes COMMAN D The COMMAN D parameter is selected when faceplate...

Страница 326: ...mode sysdtlehgaia_fp hda Process Point Faceplate EHG Analog Input Block Point No No No None No auto selection sysdtlehgaoa_ fp hda Process Point Faceplate EHG Analog Output Block Point Yes OP Yes Based on Mode OP auto selects if the mode is MAN when the faceplate is called up and when the operator changes the faceplate s mode to MAN sysdtlehgcca_ fp hda Process Point Faceplate EHG Control Counter ...

Страница 327: ...put Block Point No No No None No auto selection sysdtlehgddoa_ fp hda Process Point Faceplate EHG Dual Digital Output Block Point Yes OP Yes Based on Mode OP auto selects if the mode is MAN when the faceplate is called up and when the operator changes the faceplate s mode to MAN sysdtlehgdia_fp hda Process Point Faceplate EHG Digital Input Block Point No No No None No auto selection sysdtlehgdoa_ ...

Страница 328: ... AGA 3 Orifice Meter AGA 8 Detail Setup Data sysdtlaga38grossa_ fp hda Process Point Faceplate American Gas Association AGA AGA 3 Orific Meter AGA 8 Gross Setup Data sysdtlaga78detaila_ fp hda Process Point Faceplate American Gas Association AGA AGA 7 Turbine Meter AGA 8 Detail Setup Data sysdtlaga78grossa_ fp hda Process Point Faceplate American Gas Association AGA AGA 7 Turbine Meter AGA 8 Gross...

Страница 329: ...taacqa_ fp hda Process Point Faceplate Data Acquisition Block sysdtlehgaia_ fp hda Process Point Faceplate EHG Analog Input Block Point sysdtlehgcca_ fp hda Process Point Faceplate EHG Control Counter Block Point sysdtlehgcoa_ fp hda Process Point Faceplate EHG Counter Block Point sysdtlehgddia_ fp hda Process Point Faceplate EHG Dual Digital Input Block Point sysdtlehgdia_ fp hda Process Point Fa...

Страница 330: ...product in the documents or files accompanying such third party materials in a file named third_party_licenses on the media containing the product or at http www honeywell com ps thirdpartylicenses Documentation feedback You can find the most up to date documents on the Honeywell Process Solutions support website at http www honeywellprocess com support If you have comments about Honeywell Process...

Страница 331: ... n Contact your local Honeywell Technical Assistance Center TAC listed in the Support section of this document Support For support contact your local Honeywell Process Solutions Customer Contact Center CCC To find your local CCC visit the website https www honeywellprocess com en US contact us customer support contacts Pages default aspx Training classes Honeywell holds technical training classes ...

Отзывы: