283
FFT Analysis Modes
Auto-correlation Function
Shows the correlation of two points on the input signal at time differential
t.
Main uses:
• To detect periodicity in irregular signals (improving and detecting SNR)
• To inspect periodic components in a noisy waveform.
About the Functions, refer to “13.9.2 Analysis Mode Functions” (p. 289).
Axis
Display type
Description
X axis
Linear
Time display
The center (
t
= 0) is the reference. To the right is lag time (+
t), and to the left is
lead time (-
t)
Y axis
Lin-Mag
+1 to −1 (dimensionless units)
The closest correlation at time differential
t
is +1, and the least correlation is 0.
−1 indicates completely reversed polarity.
Because of the characteristics of the function,
t
= 0 b1.
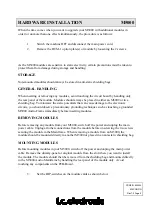
Waveform Example
X axis: Linear
Y axis: Lin-Mag
This instrument provides a circular auto-correlation function. Analysis results are normalized to the
maximum value.
13
FFT
Function
Содержание MR8827
Страница 19: ...14 Operation Precautions ...
Страница 81: ...76 Start and Stop Measurement ...
Страница 111: ...106 Manage Files ...
Страница 125: ...120 Miscellaneous Printing Functions ...
Страница 143: ...138 View Block Waveforms ...
Страница 191: ...186 Setting Output Waveform Parameters ...
Страница 291: ...286 FFT Analysis Modes Measurable Ranges With Octave Analysis 1 1 OCT 1 3 OCT ...
Страница 292: ...287 FFT Analysis Modes 1 1 OCT 1 3 OCT 13 FFT Function ...
Страница 293: ...288 FFT Analysis Modes 1 1 OCT 1 3 OCT ...
Страница 295: ...290 FFT Analysis Modes ...
Страница 309: ...304 Editor Command Details ...
Страница 387: ...382 Module Specifications ...
Страница 405: ...400 Dispose of the Instrument Lithium Battery Removal ...
Страница 431: ...A26 FFT Definitions ...
Страница 436: ......