Hioki 8870-20 Скачать руководство пользователя страница 8

Commercial Power Mains Measurement

6

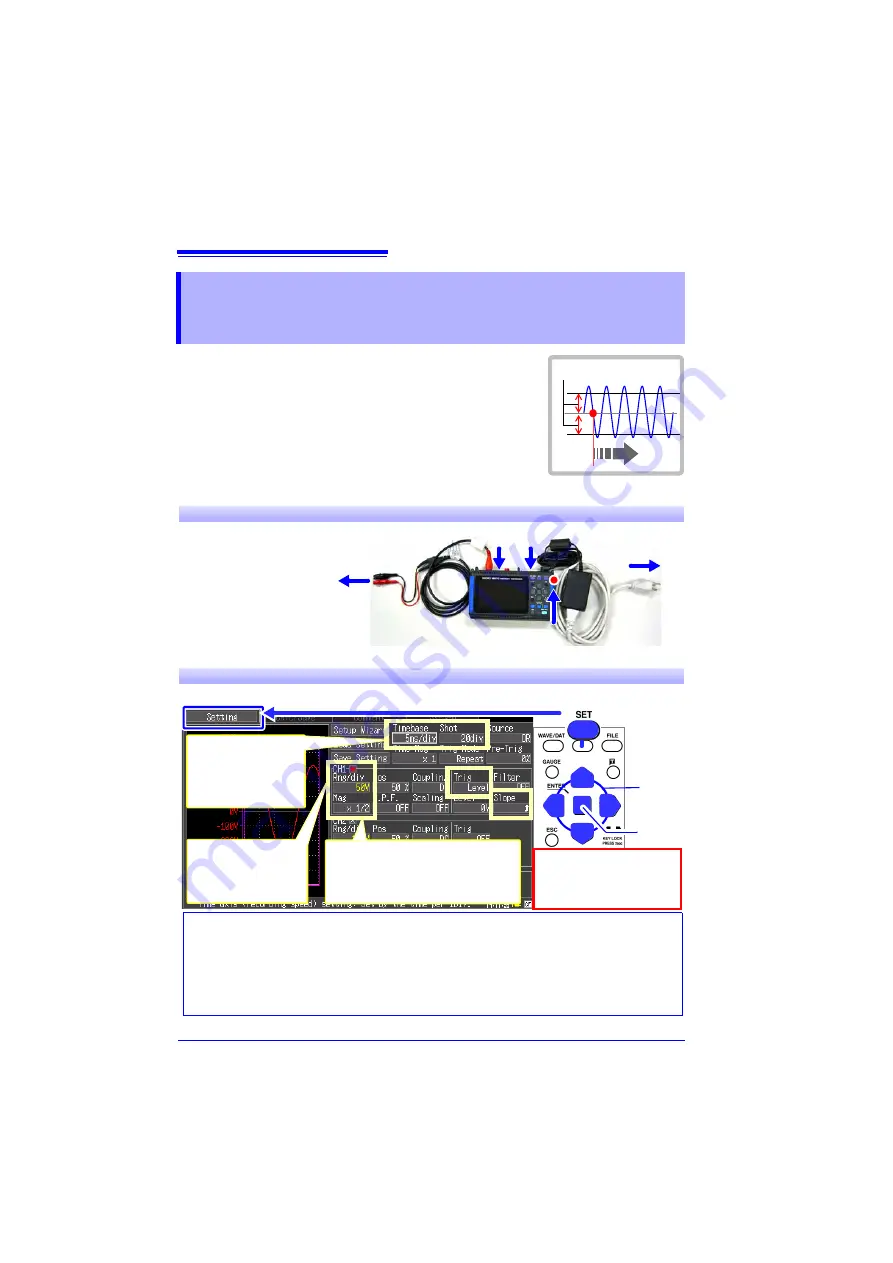
This procedure records the voltage waveform of 220 V AC 
(50/60 Hz) commercial power. The procedure for saving data 
after measurement is also described. 
In this case, the measurement criterion is specified by a 
Level trigger setting.

To measure cyclic waveforms such as that of commercial 
mains, the waveform can be best observed by establishing a 
specific level as a starting point using Level triggering.

Commercial Power Mains

Measurement

1

Prepare the following before measuring

Trigger level

Connect to the

measurement points

Items to prepare

Model 8870-20

AC Adapter (supplied)

Model L9198 Connection 
Cord

CF Card

"Measurement Procedure" 
(p. 4)

CF card

Connect to CH1

Connect to 
power outlet

1

2 3

5

4

Turn the power on

2

Configure measurement settings

Make the following settings on the Measurement Settings screen.

1

2

How to select the timebase

The timebase can be calculated from the frequency and period: 

f

 [Hz] =1/

t

 [s] (where 

f

 is the fre-

quency and 

t

 is the period)

Example: if the measurement frequency is 50 Hz

50 [Hz] = 1/

t

 [s], so 

t

 = 1/50 [s] = 0.02 [s] = 20 [ms]

To display five cycles on the screen (which is 20 divisions wide), select the timebase setting 
closest to the value calculated as follows: 20 [ms] 

 5/20 [div] = 5 ms/div.

[Timebase]

Set the time per divi-
sion on the horizontal 
axis for viewing the 
waveform.

The default settings for the 
non-framed items can be 
left as-is. 
Change as needed. 

Select

Apply

[Rng/div]

Set the voltage per di-
vision on the vertical 
axis.

[Mag] Vertical Axis Magnification

Set the zoom to 

x1/2

 when measur-

ing from 200 to 240 V AC commer-
cial power line.

Содержание 8870-20

Страница 1: ...MEMORY HiCORDER Measurement Guide 8870 20 October 2013 Revised edition 4 8870B980 04 13 10H ...

Страница 2: ......

Страница 3: ...ows the method for recording 220 V commercial mains waveforms and describes how to save data after measurement To Monitor for Abnormal Phenomena p 8 Describes how to record abnormal phenomena such as voltage drop like those that occur during electrical outages as an example type of phenomena Also describes continuous monitoring using the trig ger function to record only particular phenomena and au...

Страница 4: ...nd hides the measurement scale on the Waveform screen Manual trigger Press to trigger manually ESC Cancels changes to set tings Cursor Keys Moves the position of the cursor blink ing selection on the screen ENTER Accepts displayed settings KEY LOCK Disables keypad operations Press and hold the left and right cursor keys simul taneously for three seconds to lock and unlock the keys Press to save da...

Страница 5: ...ional information is dis played along the bottom of the screen Waveform Screen Numerical Screen Waveform Numerical Screens Settings Screens Setting Screen Calc Save Screen Comment Screen System Screen File Screen Press the left right cursor keys to se lect between the Settings screens ...

Страница 6: ...de backup during power outages and to preserve measurement data Connect the power cord Top View Connect the measurement cable When using a logic probe When using a connection cable or clamp sensor Top View BNC jack Logic connector Insert a CF card option Top View Confirm that sufficient free space is available and for auto saving that a CF card is inserted before measuring Turn the power on Right ...

Страница 7: ...al axis Voltage range Rng div Make other settings as necessary Timebase setting Settings for CH1 Settings for CH2 Settings for logic measurements To record repeatedly with the same measurement settings Trigger mode Repeat default setting Start and finish measuring Start Measurement Stop Measurement To record once and stop automatically Trigger mode Single Analyze and save ...

Страница 8: ...CH1 Connect to power outlet 1 2 3 5 4 Turn the power on 2 Configure measurement settings Make the following settings on the Measurement Settings screen 1 2 How to select the timebase The timebase can be calculated from the frequency and period f Hz 1 t s where f is the fre quency and t is the period Example if the measurement frequency is 50 Hz 50 Hz 1 t s so t 1 50 s 0 02 s 20 ms To display five ...

Страница 9: ...form is recorded for the specified duration Recording Length Trigger level 0 V Trigger slope T In this case measurement data is recorded until you press the START STOP key again Waiting for trigger 4 Save the data 1 2 Displays the Save dialog To reload data into the instrument or load it into the Wave Processor pro gram set the Format to Binary To save a screen image Screen Shot display the screen...

Страница 10: ...figure measurement settings 1 2 With pre triggering you specify that waveform recording is to begin just prior to the occurrence of an anomaly like a momentary interruption Pre triggering is set by specifying the percentage of the overall waveform re cording length to be recorded before the trigger point For this example record 10 divisions of the waveform before any momentary power drop outs The ...

Страница 11: ...it is inserted correctly Select Apply Press the START STOP key A trigger occurs when the commercial mains voltage falls below 198 Vrms After measuring the measurement data is auto matically saved to the CF Card After saving Waiting for trigger is displayed until the next time trigger conditions are met In this case measurement data is recorded until you press the START STOP key again Waiting for t...

Страница 12: ...ment Procedure p 4 2 Configure measurement settings Make the following settings on the Measurement Settings screen 1 2 Convert actual input voltage values to physical val ues such as of current using the Scaling function When using an optional clamp sensor a dialog is dis played where you select the Model for the appropriate Scaling settings After selecting the model name of the clamp sensor to be...

Страница 13: ...nd stop measurement Press the START STOP key A trigger event occurs when the signal rises to the trigger level 5 A and recording starts In this case measurement data is recorded until you press the START STOP key again Waiting for trigger Trigger Level 5 A 0 A Trigger slope T ...

Страница 14: ...The portion of a waveform that is currently displayed can be confirmed by the position of the scroll bar Whole Waveform Currently Displayed Portion Zooming the Waveform View When the A B cursors are displayed you can use them to zoom in on and out from the waveform Changes the magnification ...

Страница 15: ...ge Cursor B values Cursor type The values at the cursors are displayed Cursor selected to move When displaying only voltage values or recording time You can change the type of cursor to display As shipped from the factory Trace is set to display recording time and voltage Selecting the cursor to move Select whether to move Cursor A Cursor B or both together ...

Страница 16: ... how to apply calculations to measured data Calculate Measurement Data Make the following settings on the Calc Save screen 1 2 Set Numerical Calculation to ON and select up to four calculation types for No 1 through No 4 Select Apply Perform the following operation with the Waveform screen displayed 3 4 Select EXE and press the ENTER key to display calculation results Select Apply ...

Страница 17: ... format WAVE0001 CSV Manually saved waveform data in text format MEAS0001 CSV Manually saved numerical calculation results SCR0001 BMP Manually saved screen image AUTO131031 WAVE0003 MEM Automatically saved folder including its cre ation time Up to 1000 files WAVE0001 BMP Automatically saved screen image LIST0001 BDL Copy the 8870 20 data to a computer When the CF Card in the 8870 20 is ac cessed ...

Страница 18: ...Analysis 16 ...

Страница 19: ......

Страница 20: ......

Отзывы: