Commissioning and first steps
40/166
Ê
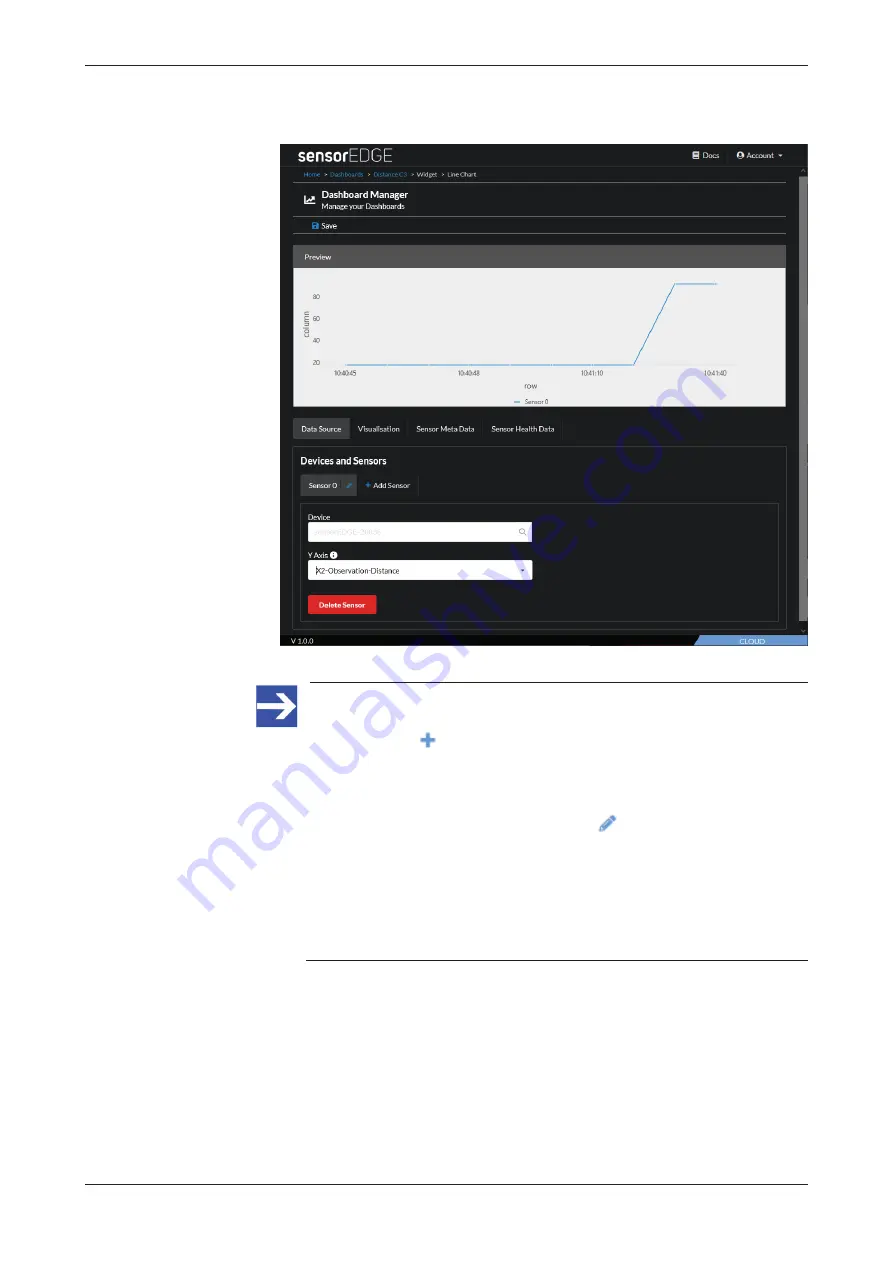
After having selected your first data source, a “preview” of the chart is
immediately displayed above the configuration panel:
Figure 18: Line Chart preview
Note:
You can add further sensor data sources to the Line Chart widget,
by clicking the
Add Sensor
button. Each sensor data source will
be presented as a separate line in the chart. By default, each new
data source is labelled as “Sensor” followed by a consecutive
number (0, 1, 2 etc.). You can define an individual name/label (that
will appear as “legend”) by clicking the
button.
The data points may come from different sensorEDGE devices (if
you are operating more than one sensorEDGE device) or from
different sensors connected to the same sensorEDGE device.
However, be aware that they all should be of the same data type
and unit (e.g. distance measurement values in centimeters or e.g.
temperature in °Celsius etc.).
netFIELD sensorEDGE | User manual
DOC200601UM01EN | Revision 1 | English | 2021-09 | Released | Public
© Hilscher 2021


