background image

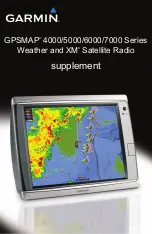
GPSMAP 4000/5000/6000/7000 Series Weather and XM Satellite Radio Supplement

XM WX Satellite Weather and Cellular Weather

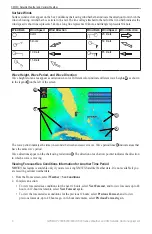
Weather Warnings and Weather Bulletins

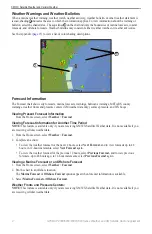
When a marine weather warning, weather watch, weather advisory, weather bulletin, or other weather statement is 

issued, shading 

 indicates the area to which the information applies. To view information about the warning or 

bulletin, select the shaded area. The aqua lines 

 on the chart indicate the boundaries of marine forecasts, coastal 

forecasts, and offshore forecasts. Weather bulletins may consist of either weather watches or weather advisories.
See the Appendix (

page 15

) to view a list of color shading descriptions.

Forecast Information

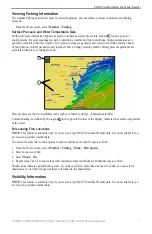
The Forecast chart shows city forecasts, marine forecasts, warnings, hurricane warnings, METARS, county 

warnings, weather fronts and pressure centers (XM weather data only), surface pressure, and WX buoys.

Viewing Present Forecast Information

From the Home screen, select 

Weather

 > 

Forecast

.

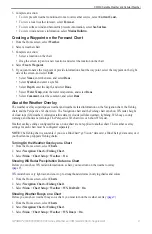
Viewing Forecast Information for Another Time Period

Note:

 This feature is available only if you are receiving XM WX Satellite Weather data. It is not available if you 

are receiving cellular weather data.
1.  From the Home screen, select 

Weather

 > 

Forecast

.

2.  Complete an action:

•  To view the weather forecast for the next 12 hours, select 

Next Forecast

, and to view forecasts up to 48 

hours, in 12-hour increments, select 

Next Forecast

 again. 

•  To view the weather forecast for the previous 12 hours, select 

Previous Forecast,

 and to view previous 

forecasts, up to 48 hours ago, in 12-hour increments, select 

Previous Forecast

 again.

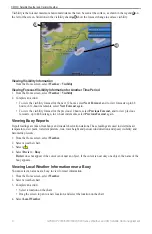
Viewing a Marine Forecast or an Offshore Forecast

1.  From the Home screen, select 

Weather

 > 

Forecast

.

2.  Pan the chart to an offshore location.

The 

Marine Forecast

 or 

offshore Forecast

 options appear when forecast information is available.

3.  Select 

Marine Forecast

 or 

offshore Forecast

.

Weather Fronts and Pressure Centers: 

Note:

 This feature is available only if you are receiving XM WX Satellite Weather data. It is not available if you 

are receiving cellular weather data.

Содержание GPSMAP 4000 Series

Страница 1: ...GPSMAP 4000 5000 6000 7000 Series Weather and XM Satellite Radio supplement...

Страница 2: ...organization of such changes or improvements Go to www garmin com for current updates and supplemental information concerning the use of this product Garmin the Gamin logo GPSMAP BlueChart GDL and g2...

Страница 3: ...GSM antenna such as the Garmin GDL 40 To connect your chartplotter to a cellular antenna refer to the installation instructions for the antenna XM Equipment Requirements To use XM WX Satellite Weathe...

Страница 4: ...r Charts 2 Storm Cell and Lightning Information 3 Hurricane Information 3 Weather Warnings and Weather Bulletins 4 Forecast Information 4 Viewing Sea Conditions 5 Viewing Fishing Information 7 Visibil...

Страница 5: ...rtplotter A day pass provides 24 hours of continuous weather data Refer to the antenna installation instructions or the instructions at http my garmin com to activate this service XM WX Satellite Weat...

Страница 6: ...this message after registering your antenna shut down your system and then turn it back on Viewing Precipitation Information Precipitation ranging from very light rain and snow up to strong thunderst...

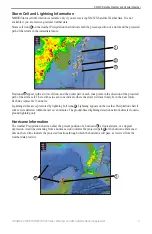
Страница 7: ...e projected path of the storm cell The red lines in each cone indicate where the storm will most likely be in the near future Each line represents 15 minutes Lightning strikes are represented by light...

Страница 8: ...on From the Home screen select Weather Forecast Viewing Forecast Information for Another Time Period NOTE This feature is available only if you are receiving XM WX Satellite Weather data It is not ava...

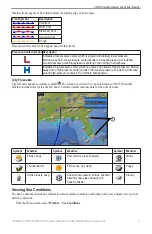
Страница 9: ...is a region of relatively higher pressure Moving away from a high pressure center results in decreased pressure Winds flow clockwise around high pressure centers in the northern hemispheres City Fore...

Страница 10: ...own in the legend on the left of the screen The wave period indicates the time in seconds between successive waves Wave period lines indicate areas that have the same wave period Wave directions appea...

Страница 11: ...e units are shown in millibars mb inches of Mercury inHg or hectopascals hPa Colored shading as defined by the legend in the upper left corner of the display indicates the surface temperature of the w...

Страница 12: ...he previous 12 hours select Previous Forecast and to view previous forecasts up to 48 hours ago in 12 hour increments select Previous Forecast again Viewing Buoy Reports Report readings are taken from...

Страница 13: ...g chart and the Perspective 3D chart view The Navigation chart and the Fishing chart can show WX radar height of cloud tops XM weather infrared satellite data for clouds cellular weather lightning WX...

Страница 14: ...me screen select Charts Navigation Chart Menu Chart Setup Weather Satellite IR On Showing Visibility Data on the Navigation Chart Before you can show visibility data on the Navigation chart you must t...

Страница 15: ...an XM antenna connected to your chartplotter and you select the cellular antenna XM weather data does not appear but your XM radio is still available if you have a paid subscription If you select the...

Страница 16: ...nnel Guide XM Radio channels are grouped in categories You can select the category of channels that appear in the channel guide 1 From the Home screen select Configure XM Audio Category 2 Select a cat...

Страница 17: ...t be configured separately 1 From the Home screen select Charts 2 Select a chart 3 Select Menu Data Bars XM Audio On Displaying the XM Radio Data Bar on the Combination Screen You can display the XM R...

Страница 18: ...S WITHOUT ANY WARRANTY OF ANY KIND EXPRESS OR IMPLIED ALL SUCH WARRANTIES OR REPRESENTATIONS INCLUDING WITHOUT LIMITATION THE IMPLIED WARRANTIES OF MERCHANTABILITY FITNESS FOR A PARTICULAR PURPOSE TIT...

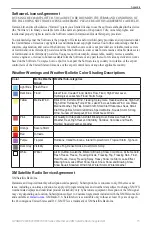
Страница 19: ...Areal Flood Coastal Flood Debris Flow Flood High Water Level Hydrological Lakeshore Flood Storm Surge Yellow Marine Wind Brisk Wind Extreme Wind Freezing Spray Gale Hazardous Seas High Surf High Wind...

Страница 20: ...G Garmin Product Support i H hurricanes 3 I infrared satellite data 9 10 L legends 6 10 lightning 3 N National Weather Service 1 Navigation chart 9 O overlay weather 9 P Perspective 3D chart 9 precip...

Страница 21: ......

Страница 22: ......

Страница 23: ......

Страница 24: ...011 Garmin Ltd or its subsidiaries Garmin International Inc 1200 East 151st Street Olathe Kansas 66062 USA Garmin Europe Ltd Liberty House Hounsdown Business Park Southampton Hampshire SO40 9LR UK Gar...
Отзывы: