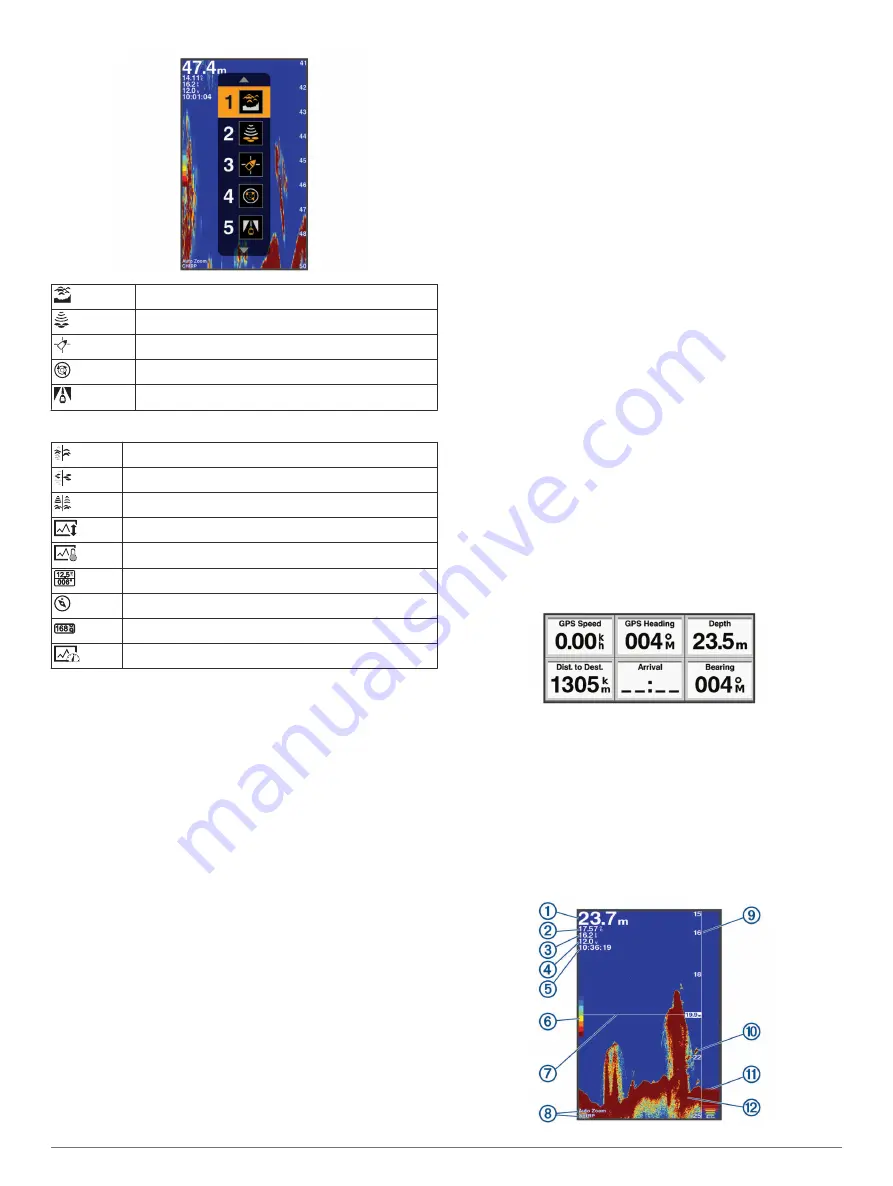
Traditional
ClearVü
Waypoint Map
AIS Radar
Highway
Default Shortcuts
Shift Zoom
ClearVüShift Zoom
Split Frequency
Depth Data Graph
Temperature Data Graph
Numbers
Compass
Trip
Speed Data Graph
Available Shortcuts
Editing the Page Shortcuts
Before you can change a page in the shortcuts menu, you must
add the page to your home screen (
).
You can change the pages that appear in the shortcuts menu.
1
From the page you want to add to the shortcuts menu, hold
PAGE
.
An editable shortcuts menu appears.
2
Select
PAGE
to select the location in the menu for the
shortcut.
3
Select
SELECT
>
Yes
.
Adding the Numbers or Trip Page
Before you can customize the Numbers or Trip screens, you
must add them to the home screen.
1
Select
Customize Home
>
Add
>
Navigation Info
.
2
Select
Numbers
or
Trip
.
Numbers
To customize the Numbers screen, select
Numbers
>
MENU
.
Change Numbers
: Sets what type of data is displayed.
Change Layout
: Sets the amount of number data that is
displayed.
Trip Page
To customize the Trip screen, select
Trip
>
MENU
.
Reset Trip
: Resets the trip data and allows you to record new
trip data.
Reset Odometer
: Resets the odometer data and allows you to
record new odometer data.
Reset Maximum Speed
: Resets the maximum speed for the trip
and allows you to record a new maximum speed.
Adding the Data Graphs or Temperature
Data Graphs Screen
You can view graphical sonar data on the home screen using
the Depth Data Graph screen. You can view temperature data
on the home screen using the Temperature Data Graph screen.
1
From the home screen, select
Customize Home
>
Add
.
2
Select
Depth Data Graph
or
Temperature Data Graph
.
Adding the Depth Data Graph Page
Before you can customize the Depth Data Graph page, you
must add it to the home screen.
From the home screen, select
Customize Home
>
Add
>
Sonar
>
Depth Data Graph
.
Data Fields
Data fields display multiple types of information in one area,
such as depth, heading, and bearing. Some data fields require
you to be navigating or require a connection to sensors to
display data. For example, a temperature sensor must be
connected to the chartplotter to display the temperature data
field.
The data fields on a page depend on the type of data associated
with that page. For example, a sonar page automatically
displays sonar-related information such as Depth.
You can configure the data fields that display on a page. Select
MENU
>
Overlay Numbers
.
Sonar
The full screen page, the split frequency page, and the flasher
page are visual representations of the area beneath your boat.
You can customize these sonar views.
Full Screen Sonar
You can see a full-view graph of sonar readings from a
transducer on the full screen.
Select Traditional.
Sonar
3
Содержание FF 650 GPS
Страница 1: ...FF 650 GPS Owner s Manual ...
Страница 23: ......


