background image

• To view the weather forecast for the previous 12 hours, 

select 

Previous Forecast

 or  , and to view previous 

forecasts, up to 48 hours ago, in 12-hour increments, 

select 

Previous Forecast

 or   again.

Viewing a Marine Forecast or an Offshore Forecast

1

Select 

Weather

 > 

Forecast

.

2

Pan the chart to an offshore location.
The Marine Forecast or Offshore Forecast options appear 

when forecast information is available.

3

Select 

Marine Forecast

 or 

Offshore Forecast

.

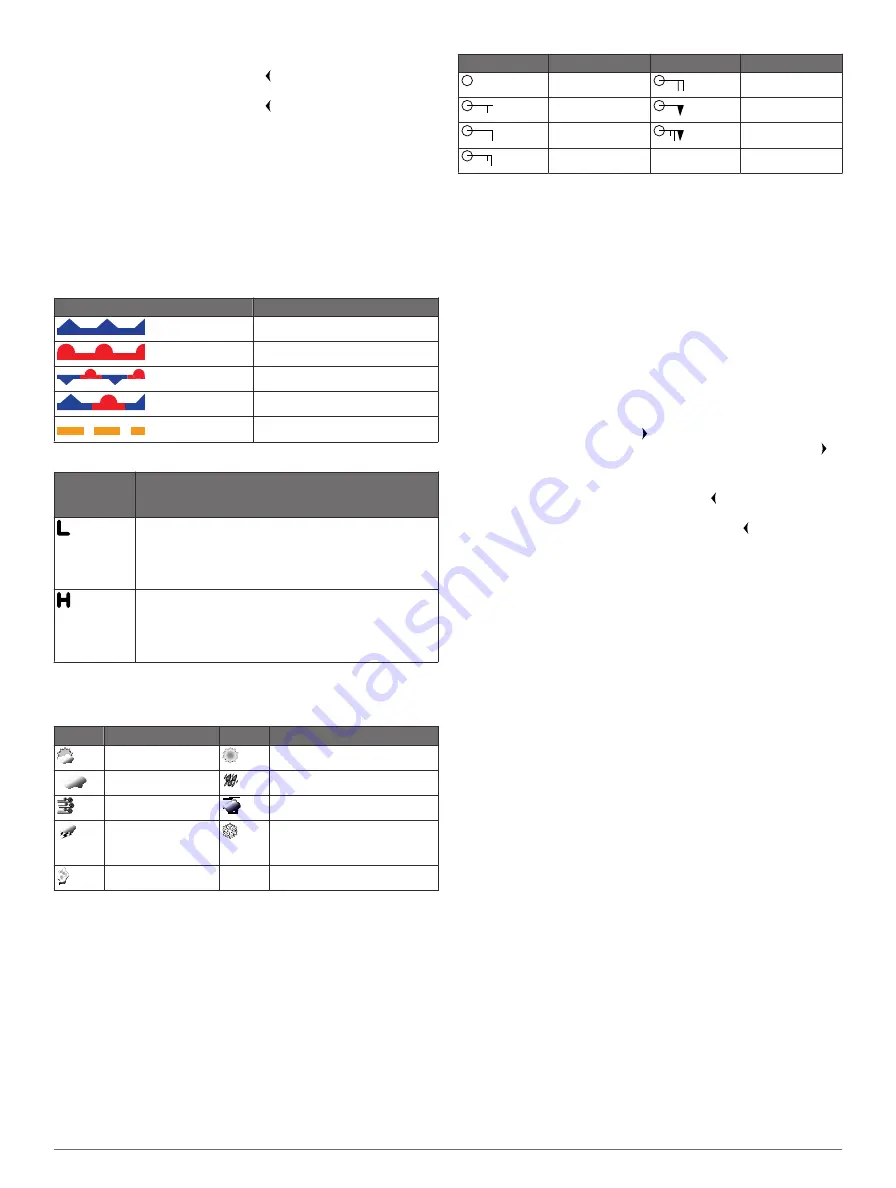
Weather Fronts and Pressure Centers

Weather fronts appear as lines that indicate the leading edge of 

an air mass.

Front Symbol

Description

Cold front

Warm front

Stationary front

Occluded front

Trough

Pressure-center symbols often appear near weather fronts.

Pressure-
Center 
Symbol

Description

Indicates a low-pressure center, which is a region of 
relatively lower pressure. Moving away from a low-
pressure center results in increased pressure. Winds 
flow counterclockwise around low-pressure centers in 
the northern hemisphere.
Indicates a high-pressure center, which is a region of 
relatively higher pressure. Moving away from a high-
pressure center results in decreased pressure. Winds 
flow clockwise around high-pressure centers in the 
northern hemisphere.

City Forecasts

City forecasts appear as weather symbols. The forecast is 

viewed in 12-hour increments.

Symbol Weather

Symbol Weather

Partly cloudy

Fair (sunny, hot, clear)

Cloudy

Rain (drizzle, sleet, showers)

Windy

Foggy

Thunderstorms

Snow (snow showers, flurries, 
blizzard, blowing snow, sleet, 
freezing rain, freezing drizzle)

Smoke (dusty, hazy)

Viewing Sea Conditions

The Sea Conditions chart shows information about surface 

conditions, including winds, wave height, wave period, and 

wave direction.

Select 

Weather

 > 

Sea Conditions

.

Surface Winds

Surface wind vectors appear on the Sea Conditions chart using 

wind barbs that indicate the direction from which the wind is 

blowing. A wind barb is a circle with a tail. The line or flag 

attached to the tail of the wind barb indicates the wind speed. A 

short line represents 5 knots, a long line represents 10 knots, 

and triangle represents 50 knots.

Wind Barb

Wind Speed

Wind Barb

Wind Speed

Calm

20 knots

5 knots

50 knots

10 knots

65 knots

15 knots

Wave Height, Wave Period, and Wave Direction

Wave heights for an area appear as variations in color. Different 

colors indicate different wave heights, as shown in the legend.
The wave period indicates the time (in seconds) between 

successive waves. Wave period lines indicate areas that have 

the same wave period.
Wave directions appear on the chart using red arrows. The 

direction of each arrow pointer indicates the direction in which a 

wave is moving.

Viewing Forecast Sea Conditions Information for 

Another Time Period

1

Select 

Weather

 > 

Sea Conditions

.

2

Select an option:
• To view forecasted sea conditions for the next 12 hours, 

select 

Next Forecast

 or  , and to view forecasts up to 48 

hours, in 12-hour increments, select 

Next Forecast

 or 

again.

• To view the forecasted sea conditions for the previous 12 

hours, select 

Previous Forecast

 or  , and to view 

previous forecasts, up to 48 hours ago, in 12-hour 

increments, select 

Previous Forecast

 or   again.

Viewing Fishing Information

The weather Fishing chart shows present water temperature, 

present surface pressure conditions, and fishing forecasts.

Select 

Weather

 > 

Fishing

.

Surface Pressure and Water Temperature Data

Surface-pressure information appears as pressure isobars and 

pressure centers. Isobars connect points of equal pressure. 

Pressure readings can help to determine weather and wind 

conditions. High-pressure areas are generally associated with 

fair weather. Low-pressure areas are generally associated with 

clouds and the chance of precipitation. Isobars packed closely 

together show a strong pressure gradient. Strong pressure 

gradients are associated with areas of stronger winds.
Pressure units are shown in millibars (mb), inches of Mercury 

(inHg), or hectopascals (hPa).
Colored shading indicates the surface temperature of the water, 

as shown in the legend in the corner of the display.

Forecasting Fish Locations

You can show areas that contain optimal weather conditions for 

specific species of fish.

1

Select 

Weather

 > 

Fishing

 > 

Menu

 > 

Fish Species

.

2

Select a species of fish.

3

Select 

On

.

4

Repeat steps 2 and 3 to show areas with optimal weather 

conditions for additional species of fish.
Shaded areas indicate optimal fishing areas. If you have 

selected more than one species of fish, you can select a 

shaded area to view the fish species that are included in the 

shaded area.

Visibility Information

Visibility is the forecast maximum horizontal distance that can 

be seen at the surface, as shown in the legend on the left of the 

SiriusXM™

21

Содержание echoMAP 50s Guide

Страница 1: ...GPSMAP 500 700 Series and echoMAP 50 70 Series Owner s Manual February 2013 190 01556 00_0A Printed in Taiwan...

Страница 2: ...registered in the USA and other countries echoMAP GXM and HomePort are trademarks of Garmin Ltd or its subsidiaries These trademarks may not be used without the express permission of Garmin The Blueto...

Страница 3: ...opping Navigation 8 Waypoints 8 Marking Your Present Location as a Waypoint 8 Creating a Waypoint at a Different Location 8 Marking and Navigating to an MOB Location 8 Viewing a List of all Waypoints...

Страница 4: ...nt of Boat Offset 18 Digital Selective Calling 18 Networked Chartplotter and VHF Radio Functionality 18 Turning On DSC 18 DSC List 18 Viewing the DSC List 18 Adding a DSC Contact 18 Incoming Distress...

Страница 5: ...Other Vessel Settings 26 Viewing System Software Information 26 Restoring the Original Chartplotter Factory Settings 26 Chartplotter Data Management 26 Copying Waypoints Routes and Tracks to a Chartpl...

Страница 6: ......

Страница 7: ...turn the chartplotter on or off GPS Satellite Signals When you turn on the chartplotter the GPS receiver must collect satellite data and establish the current location When the chartplotter acquires...

Страница 8: ...ailable with premium charts in some areas Radar Overlay Superimposes radar information on the Navigation chart or the Fishing chart when the chartplotter is connected to a radar This feature is not av...

Страница 9: ...mation That data does not ensure obstacle and bottom clearance Carefully compare the course to all visual sightings and avoid any land shallow water or other obstacles that may be in your path Optiona...

Страница 10: ...vessel includes the Maritime Mobile Service Identity MMSI location GPS speed GPS heading time that has elapsed since the last position of the vessel was reported nearest approach and time to the neare...

Страница 11: ...he safe zone For example to be notified of a pending intersection 10 minutes before it will likely occur set Time To to 10 and the alarm will sound 10 minutes before the vessel intersects the safe zon...

Страница 12: ...essary select Chart Setup 3 Select Overlay Numbers Edit Layout 4 Select a layout 5 Select a data field 6 Select the type of data shown in the field Available data options vary based on the chartplotte...

Страница 13: ...s in some areas Basic Navigation Questions Question Answer How do I make the chartplotter point me in the direction in which I want to go bearing Navigate using Go To See page 8 How do I make the devi...

Страница 14: ...ow the magenta line steering to avoid land shallow water and other obstacles NOTE When using Auto Guidance a gray segment within any part of the magenta line indicates that Auto Guidance cannot calcul...

Страница 15: ...ving a Route This procedure saves the route and all the waypoints in it The starting point can be your present location or another location 1 Select Nav Info Routes New Route Use Chart 2 Select the st...

Страница 16: ...t a color Saving a Track as a Route 1 Select Nav Info Tracks Saved Tracks 2 Select a track 3 Select Edit Track Save Route Browsing for and Navigating a Recorded Track Before you can browse a list of t...

Страница 17: ...be connected to a NMEA 2000 network capable of sensing engine and fuel data See the installation instructions for details Select Gauges Engine Customizing Engine Gauge and Fuel Gauge Limits You can c...

Страница 18: ...pecify the range of the close hauled wind gauge for both the upwind scale and the downwind scale 1 Select Gauges Wind Menu 2 Select an option To set the maximum and minimum values that appear when the...

Страница 19: ...f lower frequency sonar data NOTE The split frequency sonar view requires the use of a dual frequency transducer Select Sonar Split Frequency Pausing the Sonar Display From a Sonar view select Menu Pa...

Страница 20: ...is less than the specified value Deep Water Sets an alarm to sound when the depth is greater than the specified value Water Temp Sets an alarm to sound when the transducer reports a temperature that i...

Страница 21: ...er range targets Determine what information you need to see on the Radar screen For example do you need information about nearby weather conditions or targets and traffic or are you more concerned abo...

Страница 22: ...overlay to overlay radar information on the Navigation chart or on the Fishing chart The Radar overlay superimposes radar information on the Navigation chart or the Fishing chart Data appears on the R...

Страница 23: ...an adjust the appearance of clutter caused by choppy sea conditions The sea clutter setting affects the appearance of nearby clutter and targets more than it affects the appearance of distant clutter...

Страница 24: ...d call is received from the same boat it replaces the first call in the call list Viewing the DSC List Before you can view the DSC list the chartplotter must be connected to a VHF radio that supports...

Страница 25: ...n to call 3 Select Call with Radio Channel Making an Individual Routine Call NOTE When initiating a call from the chartplotter if the radio does not have an MMSI number programmed the radio will not r...

Страница 26: ...line represents 15 minutes Lightning strikes are represented by Lightning appears on the weather Precipitation chart if strikes were detected within the last seven minutes The ground based lightning d...

Страница 27: ...heights for an area appear as variations in color Different colors indicate different wave heights as shown in the legend The wave period indicates the time in seconds between successive waves Wave p...

Страница 28: ...ther Overlay on a Chart From the Navigation chart or Fishing chart select Menu Chart Setup Weather Weather On Weather Overlay Settings on the Navigation Chart You must turn on the weather overlay page...

Страница 29: ...et Offsets the surface reading for the depth of a keel making it possible to measure depth from the bottom of the keel instead of from the transducer location page 23 Temperature Offset Compensates fo...

Страница 30: ...APB GPBOD GPBWC GPGGA GPGLL GPGSA GPGSV GPRMB GPRMC GPRTE GPVTG GPWPL GPXTE and Garmin proprietary sentences PGRME PGRMM and PGRMZ This chartplotter also includes support for the WPL sentence DSC and...

Страница 31: ...ime Format Sets a 12 hour 24 hour or UTC time format Time Zone Sets the time zone or allows automatic selection based on GPS location Navigation Settings NOTE Some settings and options require additio...

Страница 32: ...rest or Farthest in step 8 review the placement of the Auto Guidance line and determine whether the line safely avoids known obstacles and the turns enable efficient travel Auto Guidance maintains a w...

Страница 33: ...a Transfer Card Replace From Card Saving System Information to a Memory Card You can save system information to a memory card as a troubleshooting tool A product support representative may ask you to...

Страница 34: ...Type PGN Description Transmit and receive 059392 ISO acknowledgment 059904 ISO request 060928 ISO address claim 126208 NMEA Command request and acknowledge group function 126464 Transmit and receive P...

Страница 35: ...rm 12 25 synchronizing with actual fuel 12 23 fuel onboard 23 G gauges engine 11 engines 11 environment 12 environmental data 12 fuel 11 12 limits 11 status alarms 11 trip 11 wind 12 GLONASS 23 Go To...

Страница 36: ...s software 27 user data deleting 11 V vessel trails 7 19 VHF radio 18 calling an AIS target 19 distress calls 18 DSC channel 19 individual routine call 19 individual routine calling 19 video 19 config...

Страница 37: ......

Страница 38: ...699 0800 023 3937 035 539 3727 47 815 69 555 00800 4412 454 44 2380 662 915 35 1214 447 460 34 902 007 097 46 7744 52020 Garmin International Inc 1200 East 151st Street Olathe Kansas 66062 USA Garmin...

Отзывы: