background image

weather fronts and pressure centers, surface pressure, and 

weather buoys.

Viewing Forecast Information for Another Time Period

1

Select 

Charts

 > 

Forecast

.

2

Select an option:
• To view the weather forecast for the next 48 hours, in 12-

hour increments, select 

Next Forecast

 multiple times.

• To view the weather forecast for the previous 48 hours, in

12-hour increments, select 

Previous Forecast

 multiple

times.

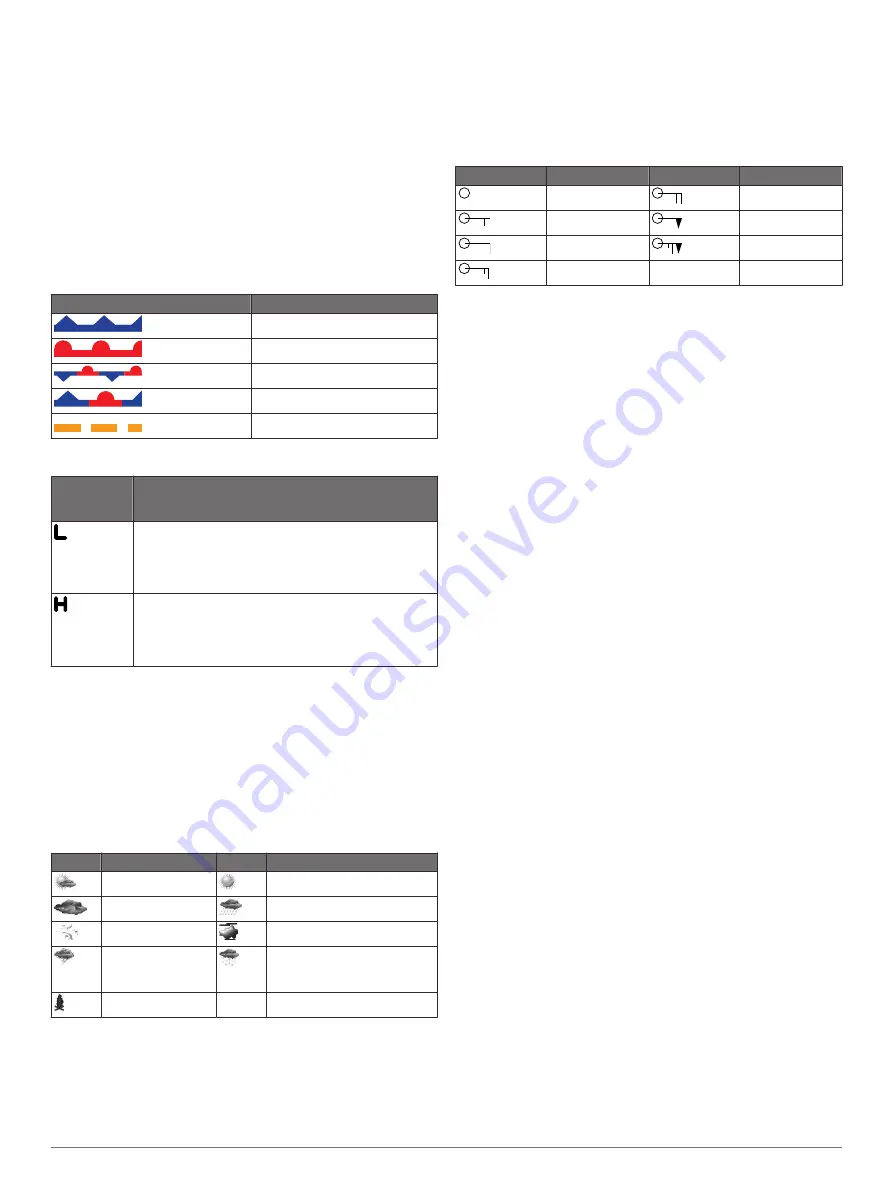
Weather Fronts and Pressure Centers

Weather fronts appear as lines that indicate the leading edge of 

an air mass.

Front Symbol

Description

Cold front

Warm front

Stationary front

Occluded front

Trough

Pressure-center symbols often appear near weather fronts.

Pressure-

Center 

Symbol

Description

Indicates a low-pressure center, which is a region of 

relatively lower pressure. Moving away from a low-

pressure center results in increased pressure. Winds 

flow counterclockwise around low-pressure centers in 

the northern hemisphere.
Indicates a high-pressure center, which is a region of 

relatively higher pressure. Moving away from a high-

pressure center results in decreased pressure. Winds 

flow clockwise around high-pressure centers in the 

northern hemisphere.

Viewing a Marine Forecast or an Offshore Forecast

1

Select 

Charts

 > 

Forecast

.

2

Pan the chart to an offshore location.
The Marine Forecast or Offshore Forecast options appear 

when forecast information is available.

3

Select 

Marine Forecast

 or 

Offshore Forecast

.

City Forecasts

City forecasts appear as weather symbols. The forecast is 

viewed in 12-hour increments.

Symbol Weather

Symbol Weather

Partly cloudy

Fair (sunny, hot, clear)

Cloudy

Rain (drizzle, sleet, showers)

Windy

Foggy

Thunderstorms

Snow (snow showers, flurries, 

blizzard, blowing snow, sleet, 

freezing rain, freezing drizzle)

Smoke (dusty, hazy)

Viewing Sea Conditions

The Sea Conditions feature shows information about surface 

conditions, including winds, wave height, wave period, and wave 

direction.

Select 

Charts

 > 

Sea Conditions

.

Surface Winds

Surface wind vectors appear on the Sea Conditions chart using 

wind barbs that indicate the direction from which the wind is 

blowing. A wind barb is a circle with a tail. The line or flag 

attached to the tail of the wind barb indicates the wind speed. A 

short line represents 5 knots, a long line represents 10 knots, 

and triangle represents 50 knots.

Wind Barb

Wind Speed

Wind Barb

Wind Speed

Calm

20 knots

5 knots

50 knots

10 knots

65 knots

15 knots

Wave Height, Wave Period, and Wave Direction

Wave heights for an area appear as variations in color. Different 

colors indicate different wave heights, as shown in the legend.
The wave period indicates the time (in seconds) between 

successive waves. Wave period lines indicate areas that have 

the same wave period.
Wave directions appear on the chart using red arrows. The 

direction of each arrow pointer indicates the direction in which a 

wave is moving.

Viewing Forecast Sea Conditions Information for 

Another Time Period

1

Select 

Charts

 > 

Sea Conditions

.

2

Select an option:
• To view forecasted sea conditions for the next 36 hours, in

12-hour increments, select 

Next Forecast

 multiple times.

• To view the forecasted sea conditions for the previous 36

hours, in 12-hour increments, select 

Previous Forecast

multiple times.

Viewing Fishing Information

The weather Fishing chart shows present water temperature, 

present surface pressure conditions, and fishing forecasts.

Select 

Charts

 > 

Fishing

.

Surface Pressure and Water Temperature Data

Surface-pressure information appears as pressure isobars and 

pressure centers. Isobars connect points of equal pressure. 

Pressure readings can help to determine weather and wind 

conditions. High-pressure areas are generally associated with 

fair weather. Low-pressure areas are generally associated with 

clouds and the chance of precipitation. Isobars packed closely 

together show a strong pressure gradient. Strong pressure 

gradients are associated with areas of stronger winds.
Pressure units are shown in millibars (mb), inches of Mercury 

(inHg), or hectopascals (hPa).
Colored shading indicates the surface temperature of the water, 

as shown in the legend in the corner of the display.

Forecasting Fish Locations

You can show areas that contain optimal weather conditions for 

specific species of fish.

NOTE: 

This feature is not available on all devices and in all 

subscriptions.

1

From the weather Fishing chart, select 

MENU

 > 

Fish 

Species

.

2

Select a species of fish.

3

Select 

On

.

4

Repeat steps 2 and 3 to show areas with optimal weather 

conditions for additional species of fish.

38

SiriusXM Weather

Содержание A03113

Страница 1: ...A03113 Owner s Manual...

Страница 2: ...armin Helm GRID and HomePort are trademarks of Garmin Ltd or its subsidiaries These trademarks may not be used without the express permission of Garmin The Bluetooth word mark and logos are owned by t...

Страница 3: ...AIS Transmission Test Alerts 7 Turning Off AIS Reception 7 AIS Display Settings 7 Chart and 3D Chart View Settings 8 Navigation and Fishing Chart Setup 8 Waypoints and Tracks Settings on the Charts an...

Страница 4: ...tail 20 Adjusting the Color Intensity 20 Adjusting the Range of the Depth Scale 21 Setting the Zoom Level on the Sonar Screen 21 Setting the Scroll Speed 21 Sonar Frequencies 21 Selecting Frequencies...

Страница 5: ...nd Graphs 32 Viewing the Gauges 32 Changing the Data Shown in a Gauge 32 Customizing the Gauges 32 Customizing Engine Gauge and Fuel Gauge Limits 32 Viewing Engine and Fuel Gauges 32 Selecting the Num...

Страница 6: ...Cameras Using On Screen Controls 40 Creating a Combination with Video Functions 40 Configuring the Video Appearance 41 Controlling the VIRB Action Camera with the Chartplotter 41 VIRB Action Camera Se...

Страница 7: ...RID Joystick 47 Cleaning the Screen 47 Viewing Images on a Memory card 47 Screenshots 47 Capturing Screenshots 47 Copying Screenshots to a Computer 48 Troubleshooting 48 My device will not acquire GPS...

Страница 8: ......

Страница 9: ...er Off to turn the chartplotter off Turn the knob to highlight options Turn the knob to zoom in or out of a screen Hold a numbered key to create a shortcut to a screen Getting More Information If you...

Страница 10: ...consistent appearance The SmartMode items are geared toward an activity such as cruising or docking When a SmartMode button is selected from the home screen each display in the station can show uniqu...

Страница 11: ...tation Layouts You can restore the factory default layouts for all stations Select Settings System Station Information Reset Stations Creating a Shortcut with a Shortcut Key You can quickly open commo...
Страница 12: ...The Fishing chart is for offshore fishing To open the Navigation chart select Charts Nav Chart To open the Fishing chart select Charts Fishing Selecting an Item on the Map Using the Device Keys 1 Fro...

Страница 13: ...your path NOTE Not all models support all charts Optional premium charts such as BlueChart g2 Vision allow you to get the most out of your chartplotter In addition to detailed marine charting premium...

Страница 14: ...ssel is moving Target is selected Target is activated The target appears larger on the chart A green line attached to the target indicates the heading of the target The MMSI speed and direction of the...

Страница 15: ...which the alarm will sound if a target is determined to intersect the safe zone For example to be notified of a pending intersection 10 minutes before it will likely occur set Time To to 10 and the a...

Страница 16: ...th an active subscription Requires a compatible connected antenna and an active subscription Chart Appearance See Chart Appearance Settings page 8 Waypoints and Tracks Settings on the Charts and Chart...

Страница 17: ...e on the maps generated by third parties is at your own risk The Garmin Quickdraw Contours mapping feature allows you to instantly create maps with contours and depth labels for any body of water When...

Страница 18: ...pensate for changes in the water level of a body of water or for depth errors in recorded maps Comm Display Offset Sets differences in contour depths and depth labels on the community contours maps to...

Страница 19: ...view additional information or to show the location on a chart Stopping Navigation While navigating from the Navigation or Fishing chart select an option Select MENU Stop Navigation When navigating wi...

Страница 20: ...rse is dynamic and it moves with your boat when you are off course 3 Follow the magenta line steering to avoid land shallow water and other obstacles 4 If you are off course follow the purple line cor...

Страница 21: ...Delete Deleting All Saved Routes Select NAV INFO User Data Clear User Data Routes Auto Guidance CAUTION The Auto Guidance feature is based on electronic chart information That data does not ensure obs...

Страница 22: ...placement of the Auto Guidance line is satisfactory select MENU Navigation Options Stop Navigation and proceed to step 10 If the Auto Guidance line is too close to known obstacles select Settings Pre...

Страница 23: ...Interval 2 Select an option To record the track based on a distance between points select Distance Change and enter the distance To record the track based on a time interval select Time Change and en...

Страница 24: ...eed to reach the start line when the timer expires By default the start line guidance window and the race timer window appear in the Sail Racing combination screen Setting the Starting Line 1 From the...

Страница 25: ...topilot Setup Wind Hold Type 2 Select Apparent or True Engaging Wind Hold Before you can enable the wind hold type you must connect a NMEA 2000 or NMEA 0183 wind sensor to the autopilot When the autop...

Страница 26: ...The Garmin ClearV scanning sonar technology emits two narrow beams similar to the shape of the beam in a copying machine These beams provide a clearer picture like image of what is beneath the boat Si...

Страница 27: ...ew shows a two dimensional view of what is in front of the boat and can be used to see a bait ball and fish Boat Range Fish Trails Bottom RealV 3D Forward Sonar View This sonar view shows a three dime...

Страница 28: ...ur boat When sharing sonar data the values of some sonar settings such as Range and Gain are synchronized across the devices on the network The values of other sonar settings such as the Appearance se...

Страница 29: ...er are drawn with the correct aspect ratio and appear less distorted When viewing Garmin ClearV or SideV sonar views it is recommend to use the Auto setting To use a very fast scroll speed select Ultr...

Страница 30: ...ernal compass NOTE To use the compass you must mount the transducer on the shaft The compass does not work when you mount the transducer on the motor NOTE Compass calibration is available only for tra...

Страница 31: ...2 1 setting draws two columns of information on the screen per sounder return and so on for the 4 1 and 8 1 settings Sonar Alarm Settings NOTE Some settings require external accessories Select Settin...

Страница 32: ...e 2 Insert the memory card into a card reader attached to a computer 3 Open the HomePort application 4 Select a sonar recording from your device list 5 Right click the sonar recording in the lower pan...

Страница 33: ...weather longer range radar signals can increase the clutter on the Radar screen and make it more difficult to view information about shorter range targets In rain shorter range radar signals can enab...

Страница 34: ...view the range bearing speed and other information about a MARPA tagged object 1 From a radar screen select a targeted object 2 Select MARPA Target Viewing a List of AIS and MARPA Threats From any Ra...

Страница 35: ...iffer from the automatic gain setting used for another mode NOTE Depending upon the radar in use the gain setting configured for use in one radar mode may or may not be applied to other radar modes or...

Страница 36: ...n select MENU Radar Options MotionScope Uses the Doppler effect to detect and highlight moving targets to help you avoid potential collisions find flocks of birds and track weather formations Pulse Ex...

Страница 37: ...Use caution when operating the autopilot near hazards in the water such as docks pilings and other boats The autopilot system continuously adjusts the steering of your boat to maintain a constant hea...

Страница 38: ...nce between the waypoint and the location where the autopilot turns the boat for another pass over the waypoint The default setting turns the boat at a range of 1000 ft 300 m from the active waypoint...

Страница 39: ...rmation Every position report call received is logged in the DSC list DSC List page 30 Viewing a Position Report 1 Select NAV INFO DSC List 2 Select a position report call 3 Select Review 4 Select an...

Страница 40: ...rating range select Rated Min To set the maximum value of the standard operating range select Rated Max To set the lower limit of the gauge lower than the rated minimum select Scale Min To set the upp...

Страница 41: ...minimum values that appear when the upwind close hauled wind gauge appears select Change Upwind Scale and set the angles To set the maximum and minimum values that appear when the downwind close haul...

Страница 42: ...ing Almanac Information from the Navigation Chart 1 From a chart or 3D chart view select a location 2 Select Information 3 Select Tides Currents or Celestial Warning Manager Viewing Messages 1 Select...

Страница 43: ...can change how you select a station for some media types such as FM or AM radio NOTE Not all tuning modes are available for all media sources 1 From the media screen select MENU Tuning Mode 2 Select a...

Страница 44: ...iusXM Connect Tuner to receive the activation message it must be turned on and receiving the SiriusXM signal 5 If the service is not activated within the hour go to http care siriusxm com refresh or c...

Страница 45: ...n screen or SmartMode layout with a weather chart select MENU Weather Menu Change Weather 2 Select a weather chart Viewing Precipitation Information Precipitation ranging from very light rain and snow...

Страница 46: ...of the wind barb indicates the wind speed A short line represents 5 knots a long line represents 10 knots and triangle represents 50 knots Wind Barb Wind Speed Wind Barb Wind Speed Calm 20 knots 5 kn...

Страница 47: ...lletin Creating a Waypoint on a Weather Chart 1 From a weather chart select a location 2 Select New Waypoint Weather Overlay The weather overlay superimposes weather and weather related information on...

Страница 48: ...image Change Scene Selects the infrared image mode such as day night MOB or docking Video Setup Opens more video options Video Settings Some cameras provide additional setup options NOTE Not all opti...

Страница 49: ...VIRB action camera Recording Starts and stops recording Take Photo Takes a still photograph Sleep Puts the VIRB action camera into a low power mode to conserve battery power VIRB Action Camera Video...

Страница 50: ...hides the menu bar when it is not needed Units Settings Select Settings Preferences Units System Units Sets the unit format for the device Variance Sets the magnetic declination the angle between mag...

Страница 51: ...ce line is too close to known obstacles select Settings Preferences Navigation Auto Guidance Shoreline Distance Farthest If the turns in the Auto Guidance line are too wide select Settings Preferences...

Страница 52: ...ets the alarm to sound only when large fish are detected Setting Weather Alarms Before you can set weather alarms you must have a compatible chartplotter connected to a weather device such as a GXM de...

Страница 53: ...ables digital selective calling DSC Collision Alarm Sets the collision alarm Setting the Safe Zone Collision Alarm page 7 AIS EPIRB Test Enables test signals from Emergency Position Indicating Radio B...

Страница 54: ...y when they are turned on and within range Connecting a Garmin Nautix Device to the Chartplotter Pairing is the initial connection of two compatible wireless devices For example the first time you con...

Страница 55: ...stem contact your Garmin dealer Pairing the GRID Remote Input Device with the Chartplotter Before you can use a GRID remote input device with a chartplotter you must pair the devices You can initiate...

Страница 56: ...ypoints in the correct location You can manually enter a waypoint location to transfer and share data from one device to the next If you have manually entered a waypoint using coordinates and the loca...

Страница 57: ...Riggs Avenue Severna Park MD 21146 USA www nmea org Software License Agreement BY USING THE DEVICE YOU AGREE TO BE BOUND BY THE TERMS AND CONDITIONS OF THE FOLLOWING SOFTWARE LICENSE AGREEMENT PLEASE...

Страница 58: ...al switching 47 distress call 31 distress signal device 7 DSC See digital selective calling E EBL 26 adjusting 26 measuring 26 showing 26 engine gauges 32 configuring 32 status alarms 32 EPIRB 7 event...

Страница 59: ...appearance 23 bottom lock 21 color gain 20 color rejection 23 cone 9 depth 21 depth scale 21 frequencies 21 FrontV 19 gain 20 Garmin ClearV 18 interference 23 measuring distances 20 noise 20 numbers...

Страница 60: ...wind speed graph 33 wireless devices 41 45 46 connecting a wireless device 45 46 network configuration 45 Z zoom sonar 21 52 Index...

Отзывы: