2. GRAPH FUNCTIONS
2-22
2.5
Temp Graph
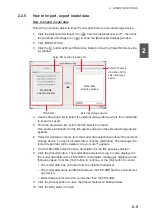
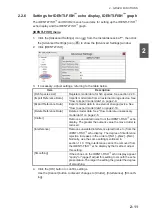
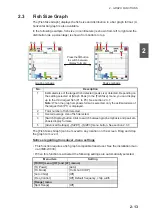
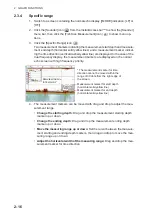
The [Temp Graph] plots water temperature using water temperature data. The source
for water temperature data is set during the installation of the equipment.
To show the [Temp Graph], click the [Graph] icon (
) from the InstantAccess bar™
to show the [Graph] menu, then click the [Temp Graph] icon (
). The icon is high-
lighted in green and the graph appears. The graph scale and the graph line color can
be changed. See section 4.3.
To close the graph, click the [Graph] icon (
) from the InstantAccess bar™ to show
the [Graph] menu, then click the [Temp Graph] icon (
).
Graph scale
Graph scale
Water temperature graph
Water temperature graph
Содержание FSS-3BB
Страница 12: ...SYSTEM CONFIGURATION x This page is intentionally left blank...
Страница 98: ...4 ADVANCED SETTINGS 4 20 This page is intentionally left blank...
Страница 110: ...5 MAINTENANCE AND TROUBLESHOOTING 5 12 This page is intentionally left blank...
Страница 119: ......
Страница 120: ......
Страница 121: ......


