


2. GRAPH FUNCTIONS
2-5
2
2.2.5
Bottom trace
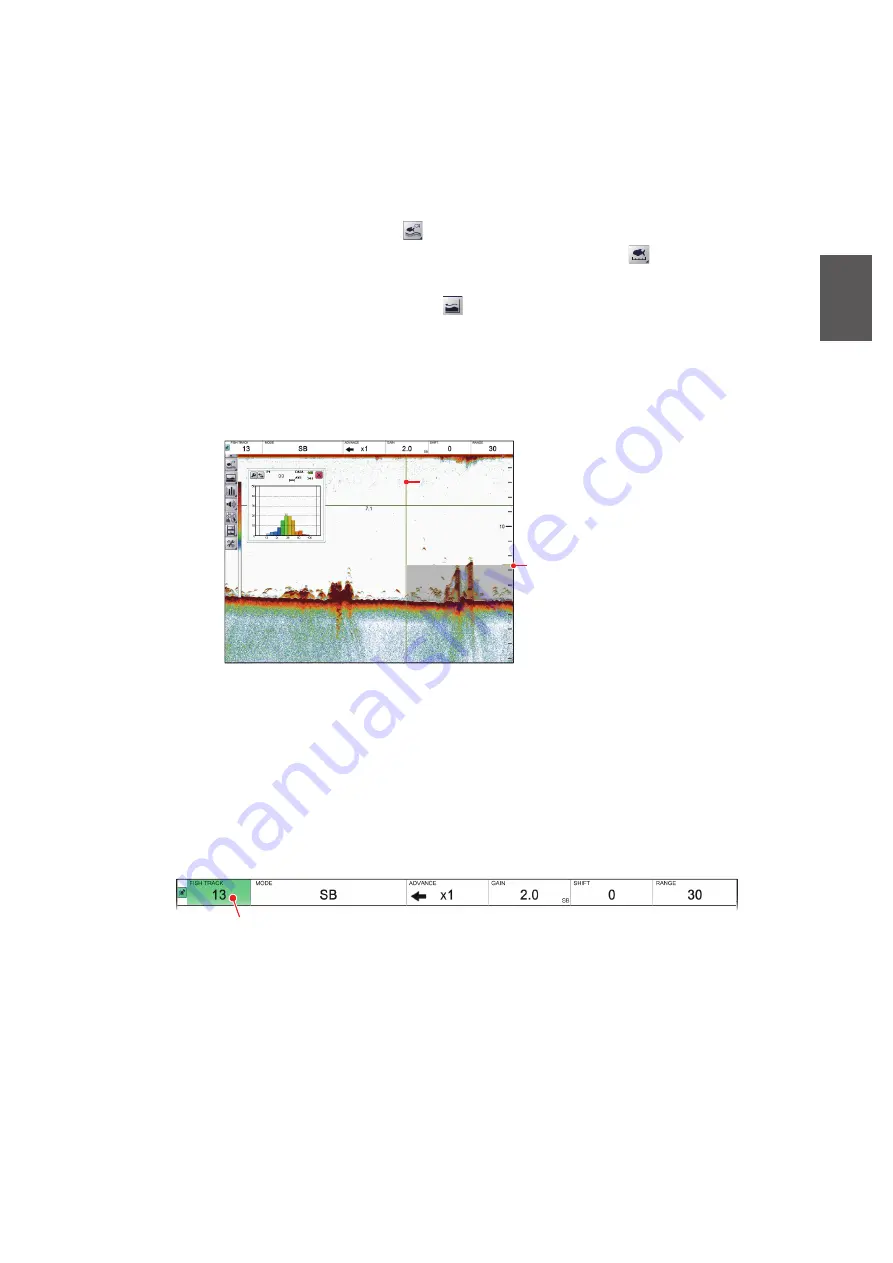
This method produces two marker lines. The horizontal, small line at the right-hand
edge of the screen is the measurement range marker. The vertical line is the measure-
ment location.
1. Switch to a display that includes the split beam display ([MODE] indication: [SB]).
2. Click the [Sounder] icon (
) from the InstantAccess bar™ to show the [Sounder]
menu bar, then click the [Fish Size Measurement] icon (
) to show menu op-
tions.
3. Click the [Bottom Trace] icon (
). [FISH TRACK] appears in the Miscellaneous
section of the header. The start depth measurement marker (horizontal yellow sol-
id line) and the time direction measurement marker (vertical yellow dashed line)
appear.
Note:
If "----" appears in the depth indication box at the bottom of the screen, the
measurement marker is not shown. Measurement is not possible.
4. Put the cursor in the far left-hand window in the header.
5. Click the [FISH TRACK] window, then scroll to change the setting.
The [FISH TRACK] window is highlighted in green when its contents can be
changed. The larger the value, the wider the measurement range based on the
seabed position, and the smaller the value, the narrower. The measurement
marker for measurement start depth (horizontal yellow solid line) moves according
to the set value.
6. Drag and drop the measurement marker for time direction (vertical yellow dashed
line) to adjust the measuring range.
Measurement marker for
measurement start depth
(Horizontal yellow line)
* The measurement marker in the time direction cannot be moved
within the range of 30 dots from the right edge of the screen.
Measurement
range
Measurement
range
Measurement marker
for time direction*
(Vertical yellow line)
Measurement marker
for time direction*
(Vertical yellow line)
[FISH TRACK] window


