XG Series User's Guide
Chapter 5 Command Reference
Ethernet L3 Monitor Function Counter, Log, Statistics, and Status Display
and Clear Operation Commands
538
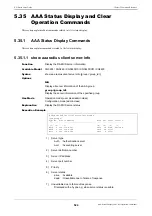
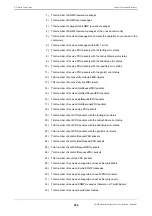
4)
The address to be monitored
5)
Link aggregation group number
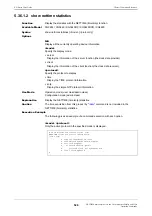
5.39.1.2 show icmpwatch statistics
Function
Display the statistics of Ethernet L3 monitor function.
Available Model
XG0224 / XG0448 / XG0440DC / XG0440DCR / XG2600
Syntax
show icmpwatch statistics
Options
N/A
Display all statistics.
Use Mode
Operation mode (user class/admin class)
Configuration mode (admin class)
Explanation
Display the statistics provided by the Ethernet L3 monitor function.
Information about the Ethernet ports where the Ethernet L3 monitor function is enabled,
and the link aggregation group is displayed.
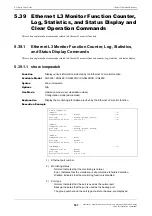
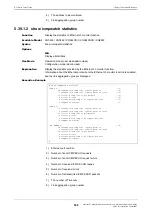
Execution Example
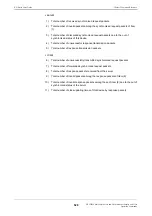
1)
Ethernet port number
2)
Number of sent ICMP ECHO requests
3)
Number of sent ICMP ECHO request errors
4)
Number of received ICMP ECHO replies
5)
Number of received errors
6)
Number of retransmitted ICMP ECHO packets
7)
The number of Timeouts
8)
Link aggregation group number
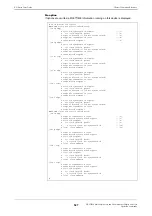
# show icmpwatch statistics
[PORT-1] ---(1)
20 transmitted icmp echo request packets ---(2)
0 transmitted icmp echo request packets error ---(3)
19 received icmp echo reply packets ---(4)
0 received error ---(5)
5 retransmitted icmp echo request packets ---(6)
1 icmpwatch timeout ---(7)
[PORT-3]
37 transmitted icmp echo request packets
0 transmitted icmp echo request packets error
37 received icmp echo reply packets
0 received error
0 retransmitted icmp echo request packets
0 icmpwatch timeout
[LA GROUP-1] ---(8)
14 transmitted icmp echo request packets
1 transmitted icmp echo request packets error
14 received icmp echo reply packets
0 received error
0 retransmitted icmp echo request packets
0 icmpwatch timeout
#

