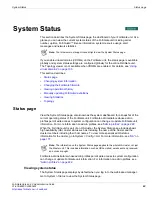
System Status
Status page
FortiGate Version 4.0 Administration Guide
01-400-89802-20090424
77
•
top viruses to show
Top Attacks
Top Attacks displays a bar graph representing the most numerous attacks detected by the
FortiGate unit.
The Top Attacks display is not part of the default dashboard display. It can be displayed by
selecting
Add Content > Top Attacks
from the drop down menu.
Selecting the history icon opens a window that displays up to the 20 most recent attacks
that have been detected with information including the attack name, when it was last
detected, and how many times it was detected. The FortiGate unit stores up to 1024
entries, but only displays up to 20 in the web-based manager.
Selecting the Edit icon for Top Attacks allows changes to the:
•
refresh interval
•
top attacks to show
Traffic History
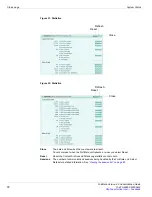
The traffic history display shows the traffic on one selected interface over the last hour,
day, and month. This feature can help you locate peaks in traffic that you need to address
as well as their frequency, duration, and other information.
Only one interface at a time can be monitored. You can change the interface being
monitored by selecting Edit, choosing the interface from the drop down menu, and
selecting Apply. Doing this will clear all the traffic history data.
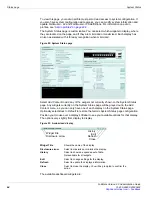
Figure 37: Traffic History
Interface
The interface that is being monitored .
kbit/s
The units of the traffic graph. The scale varies based on traffic
levels to allow it to show traffic levels no matter how little or how
much traffic there is.
Last 60 Minutes
Last 24 Hours
Last 30 Days
Three graphs showing the traffic monitored on this interface of the
FortiGate unit over different periods of time.
Certain trends may be easier to spot in one graph over the others.
Traffic In
The traffic entering the FortiGate unit on this interface is indicated
with a thin red line.
Traffic Out
The traffic leaving the FortiGate unit on this interface is indicated
with a dark green line, filled in with light green.
Interface being
monitored
Содержание Gate 60D
Страница 678: ...Reports Log Report FortiGate Version 4 0 Administration Guide 678 01 400 89802 20090424 http docs fortinet com Feedback...
Страница 704: ...Index FortiGate Version 4 0 Administration Guide 704 01 400 89802 20090424 http docs fortinet com Feedback...
Страница 705: ...www fortinet com...
Страница 706: ...www fortinet com...

