


FortiAnalyzer Version 3.0 MR3 Administration Guide
28
05-30003-0082-20060925
Dashboard
Configure the FortiAnalyzer unit
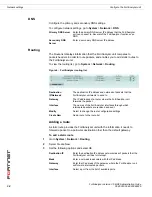
System Information
The System Information area of the Dashboard displays the current state of the
FortiAnalyzer unit. The System Status area includes the following information:
System Resources
The system resources displays how the FortiAnalyzer unit’s resources are being
used. You can monitor the CPU, memory and hard disk use and quickly see at
what capacity the FortiAnalyzer unit is running. System resources includes the
following information:
Serial Number
The serial number of the FortiAnalyzer unit. The serial number is
unique to the FortiAnalyzer unit and does not change with
firmware updates. Use this number when registering your
FortiAnalyzer unit with Fortinet.
Uptime
The time in days, hours and minutes since the FortiAnalyzer was
started or last rebooted.
System Time
The current time according to the FortiAnalyzer internal clock.
Select Change to change the time or configure the FortiAnalyzer
unit to obtain the time from an NTP server. For details see
.
Host Name
The name of the FortiAnalyzer unit. For details on changing the
“Changing the host name” on page 36
.
Firmware Version
The version of the firmware installed on the FortiAnalyzer unit.
Select Update to upload a new version of the firmware. For details
on updating the firmware see
.
CPU Usage
The current CPU status. The web-based manager displays CPU
usage for core processes only. CPU usage for management
processes (for example, for HTTPS connections to the web-based
manager) is excluded.
Memory Usage
The current memory status. The web-based manager displays
memory usage for core processes only. Memory usage for
management processes (for example, for HTTPS connections to
the web-based manager) is excluded.
Hard Disk Usage /
RAID status
For the FortiAnalyzer-100 and FortiAnalyzer-100A/100B, the
current status of the hard disk. The web-based manager displays
the amount of hard disk space used.
For the FortiAnalyzer-400, FortiAnalyzer-800, FortiAnalyzer-2000
and FortiAnalyzer-4000/4000A, the current RAID status of the
hard disks. Each circle indicates the status of a hard disk. Green
indicates the hard disk is functioning normally. If the disk is
flashing red and yellow, there is a problem with the hard disk.
The hard disks on the FortiAnalyzer-2000 and
FortiAnalyzer-4000/4000A are hot swappable. For details see
swapping the FortiAnalyzer-2000 and FortiAnalyzer-4000/4000A”
History icon
Select History to view a graphical representation of the last minute
of CPU, memory, sessions, and network usage. For more
“Viewing operational history” on page 30
.
Содержание FortiAnalyzer-100A
Страница 1: ...www fortinet com FortiAnalyzer Version 3 0 MR3 A D M I N I S T R A T I O N G U I D E...
Страница 10: ...FortiAnalyzer Version 3 0 MR3 Administration Guide 10 05 30003 0082 20060925 Contents...
Страница 76: ...FortiAnalyzer Version 3 0 MR3 Administration Guide 76 05 30003 0082 20060925 Blocked Devices Devices...
Страница 88: ...FortiAnalyzer Version 3 0 MR3 Administration Guide 88 05 30003 0082 20060925 Log rolling Logs...
Страница 94: ...FortiAnalyzer Version 3 0 MR3 Administration Guide 94 05 30003 0082 20060925 Log rolling Content archive...
Страница 138: ...FortiAnalyzer Version 3 0 MR3 Administration Guide 138 05 30003 0082 20060925 Output Alerts...
Страница 150: ...FortiAnalyzer Version 3 0 MR3 Administration Guide 150 05 30003 0082 20060925 Log rolling Network Analyzer...
Страница 156: ...FortiAnalyzer Version 3 0 MR3 Administration Guide 156 05 30003 0082 20060925 Reports Vulnerability scan...
Страница 161: ...www fortinet com...
Страница 162: ...www fortinet com...


