


169
FIS Viewer
3. Then enter a minimum and maximum for the Y axis in the appropriate field.
4. Click
OK
.
The diagram displays your defined zoom selection.
With
Reset
you can undo your settings.
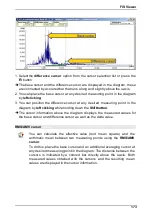
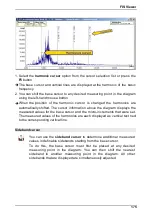
5.3.5 Cursor tools
A cursor can b e positioned in the diagram b y clicking
near a measured value or moved b y dragging the dotted
vertical line along the diagram axis keeping the mouse
b utton pressed down.
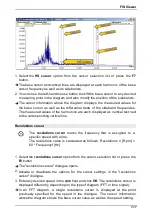
Sliding cursors are always represented b y a dotted
vertical line whereas fixed cursors or automatically
calculated data displays are represented b y a continuous
vertical line.
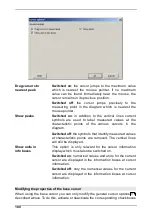
Base cursor
You can use the
base cursor
to determine the measured values on the
x- and y-axis of a measuring point.
To do this, place a base cursor at any desired measuring point in the
diagram. The corresponding measured values are displayed in the
cursor information.