


158
Tool & symbol
Description
Revolutions cursor
(FFT, time signals)
The rev olutions cursor marks the frequency that is assigned to a
specific speed w ith a line.
A cursor can only b e placed at a measuring point that
exists. If you click on a position in the diagram where no
measured value exists the cursor automatically jumps to
the nearest existing measuring point.
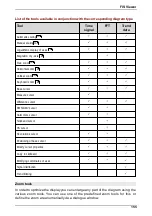
Additional tools
In addition to the zoom and cursor tools you can use a range of further tools to
change the manner in which signals or cursors are displayed and transfer data to
other programs via the clipboard.
Tool & symbol
Description
Positioning of
base cursor
Places the base cursor at a point in the diagram specified v ia
numeric input. The base cursor jumps to the measuring point
nearest the v alue entered.
Cursor
properties
Opens the cursor properties dialogue w indow w here y ou can
change the properties of the cursor currently used.
Clipboard
Copies an image of the current diagram v iew into the clipboard (
additional information
).
Change diagram
boundaries
Changes the display of minimum/max imum v alues for the x - and
y -ax is (additional information
).
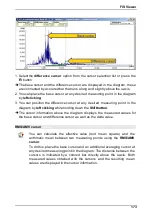
5.2.4 Diagram display
The diagram area shows the FFT, time signals and trend data diagrams. You can
specify the desired zoom area inside the diagrams and adjust the position of the
cursor using the mouse or keyboard.
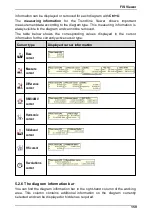
5.2.5 Cursor and measuring information
The
cursor information
for the Trendline Viewer shows important values and
measurement data that vary depending on the cursor tool used. Each item of
cursor information contains either the value pairs for a measured value or
calculated characteristic values that are obtained by combining different cursors
within the diagram such as the difference cursor or RMS/AMV cursor. The cursor
185
186