Exinda Network Orchestrator
3 Using
|
242
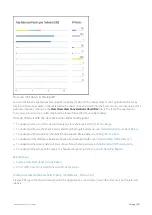
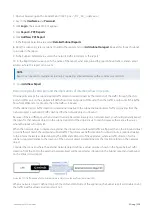
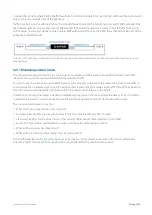
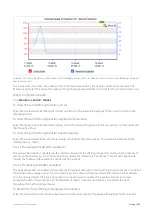
How do I interact with the new time-series & bar chart reports?
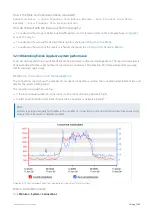
To understand how to set the desired time range for a chart, see
To understand how to the charts interact and what the toggle buttons do, see
Understanding How Charts Relate
.
To understand how to drill into the data to find particular filtered data, see
To understand the difference between inbound and outbound traffic, see
Understanding Traffic Direction
To understand how many data points are shown for each time period, see
Understanding Traffic Granularity
To understand how to print the report or schedule the report, see
Printing and Scheduling Reports
.
3.2.12 Monitoring the effects of controls
This section of the chapter deals with the reports available in the
Control
interface. These reports provide information
related the effect of applied policies, the discarded packets, and how prioritization has worked to assist your preferred
applications.
Monitoring the effects of policy controls
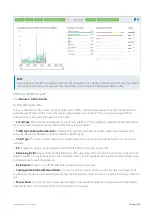
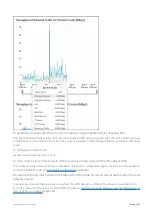
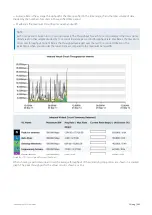
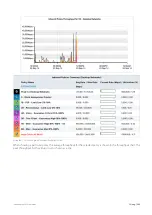
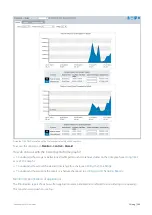
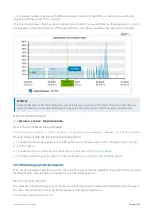
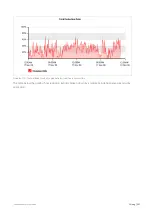
The Policies report shows the average throughput and the peak throughput for a circuit, a virtual circuit, or a policy over
time. However, only the traffic that fell into a bandwidth shaping (control) policy is reported. The traffic inbound to your
LAN is shown separately from the outbound traffic.
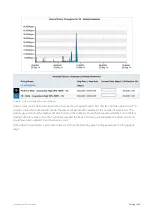
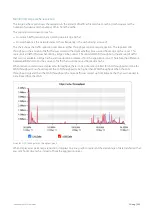
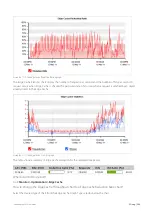
If your virtual circuit was defined to provide fair sharing among hosts, the Dynamic Virtual Circuit cart will show the
number of active hosts and the number of hosts that exceeded the limit and therefore were not processed by the virtual
circuit.
This report answers questions such as:
Are my control policies having the effect I need them to?
How much traffic is being controlled?
Are my policies actively limiting the traffic?
How much traffic is hitting my ‘Choke P2P’ policy?
Are hosts being excluded from the dynamic virtual circuit?
NOTE
The Policies report only shows traffic for control and bandwidth shaping policies. Accelerated traffic is not included
in this report.
VERSION INFO
Showing the peak throughput is available in version 7.0.1 Update 1 and later.
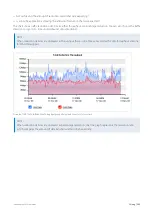
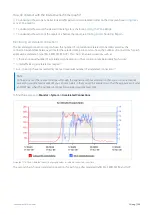
When showing the circuit, the average throughput of the underlying virtual circuits are shown in a stacked graph. The
peak throughput for the circuit is shown as a line. Any of the virtual circuits or the peak throughput for the circuit can be
removed from the chart by clearing the checkbox in the table below the graph.
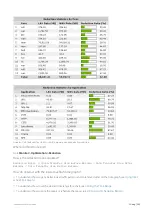
The table beneath the graph shows some additional information for the selected time period.
Maximum Bandwidth is the amount of bandwidth specified in the virtual circuit. The maximum, average, and current
rates are measured as per-second throughput.
Содержание EXNV-10063
Страница 98: ...Exinda Network Orchestrator 2 Getting started 98 6 Click New The New Virtual Hard Disk wizard opens ...
Страница 99: ...Exinda Network Orchestrator 2 Getting started 99 7 Select VHDX as the Disk Format type and click Next ...
Страница 130: ...Exinda Network Orchestrator 2 Getting started 130 Screenshot 35 The life cycle of configuration status ...
Страница 369: ...Exinda Network Orchestrator 4 Settings 369 ...
Страница 411: ...Exinda Network Orchestrator 4 Settings 411 Screenshot 168 P2P OverflowVirtualCircuit ...
Страница 420: ...Exinda Network Orchestrator 4 Settings 420 Screenshot 175 Students OverflowVirtualCircuit ...
Страница 451: ...Exinda Network Orchestrator 4 Settings 451 ...

