COMPONENT MAINTENANCE MANUAL
BA27
24-01-01
T
h
is docum
ent
contains D
a
ta
control
led by th
e U.S. Export Admini
str
a
tion
Reg
u
lati
ons. Di
versio
n or use
contrary to U.S. law is
proh
ibit
ed
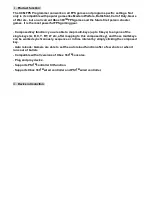
The graph in figure 2 demonstrates the effect of temperature on battery
capacity at various discharge rates
.
Variation in Performance with Discharge Temperature
Figure 2
Page 5
June 09/06
DISCHARGE PERFORMANCE (SELECTED DISCHARGE RATINGS)
AS A FUNCTION OF TEMPERATURE
0
10
20
30
40
50
60
70
80
90
100
110
120
130
140
150
"-30 C
"-20 C
"-10 C
0 C
10 C
20 C
30 C
40 C
DEGREES CELSIUS
DI
SCHARGE PERF
O
RMANCE AS % OF
PERF
O
RMANCE @ 20oC
5 MIN RATE
15 MIN RATE
30 MIN RATE
60 MIN RATE