5 Data access and configuration of interfaces
Querx TH provides several interfaces to make the measured
data available over Ethernet and to send out notifications on
occurring events.
5.1 Web interface
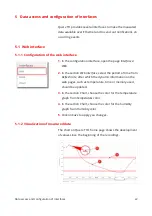
5.1.1 Configuration of the web interface
1.
In the configuration interface, open the page
Interfaces /
Web.
2.
In the section
Web interface
, select the period of time from
Refresh rate
, after which the dynamic information on the
web pages, such as temperature, time or memory used,
should be updated.
3.
In the section
Chart
, choose the color for the temperature
graph from
Temperature color
.
4.
In the section
Chart
, choose the color for the humidity
graph from Humidity
color
.
5.
Click on
Save
to apply you changes.
5.1.2 Visualization of measured data
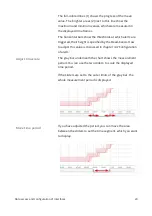
The chart on Querx TH's home page shows the development
of values since the beginning of the recordings.
Data access and configuration of interfaces
22


