


01/05
P/N 120413
53
User’s Manual
Tools Screen
Banner Engineering Corp.
• Minneapolis, MN USA
www.bannerengineering.com • Tel: 763.544.3164
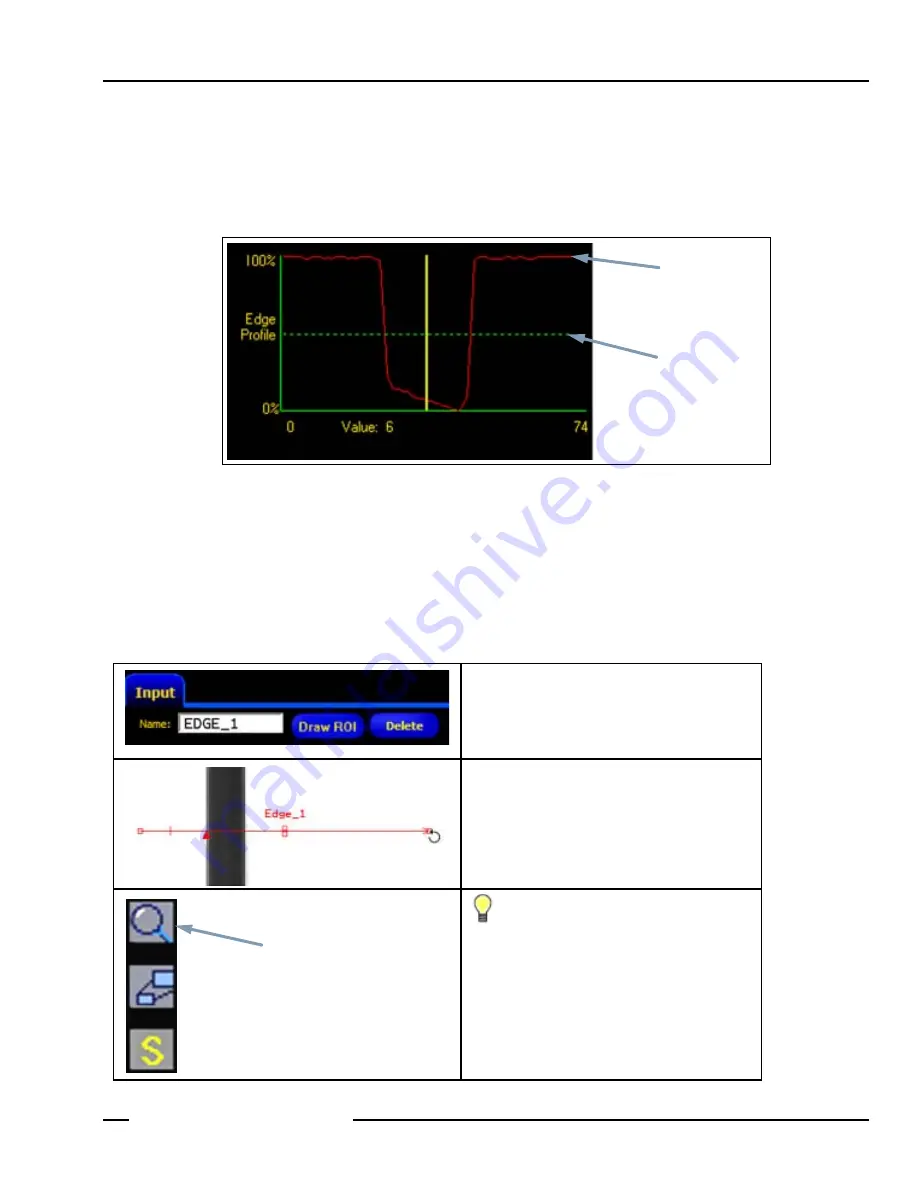
Linear Tool Profile Graph
The Tool Profile graph, shown below, is used with all linear ROIs. The graph represents the pixel values along the ROI. The
vertical axis is representative of the gray scale or gradient level, and the horizontal axis represents the position (in pixels) along
the ROI. The curve on the graph (red line on the screen) represents the edge profile, and the horizontal dashed line (green on
the screen) represents the threshold level.
-----------------------------------------------------
Tool Profile Graph (Relative Threshold Shown)
-----------------------------
Drawing ROIs
Use the following procedures to draw, move, edit, and delete ROIs.
To Draw an ROI
1. Click on the
Draw ROI
button in the tool’s
Input
tab.
3. Hold the mouse selection button, and drag the
mouse to create the ROI shape in the Image
window.
To move or edit the ROI after letting go of the
mouse, see
To Move, Edit, or Delete an ROI
TIP:
Use the Magnify button to the left of the
Image window for a closer view of the ROI.
Pixel Intensity
Threshold Line
Magnify Button
Содержание PresencePlus P4
Страница 1: ...Printed in USA P N 120413...
Страница 3: ...This User s Manual reflects Sensor Firmware Version 1 0 0 and GUI Software Version 2 0 2...
Страница 4: ......
Страница 8: ......
Страница 180: ......
Страница 181: ......


